NZD/USD extends losses, bullish momentum fades further
- NZD/USD slides lower by 0.25% on Thursday, extending its losing streak.
- Selling pressure gains pace as the RSI and MACD indicate a potential reversal.
- Pair continues trading in the 20-day and 200-day SMA channels.
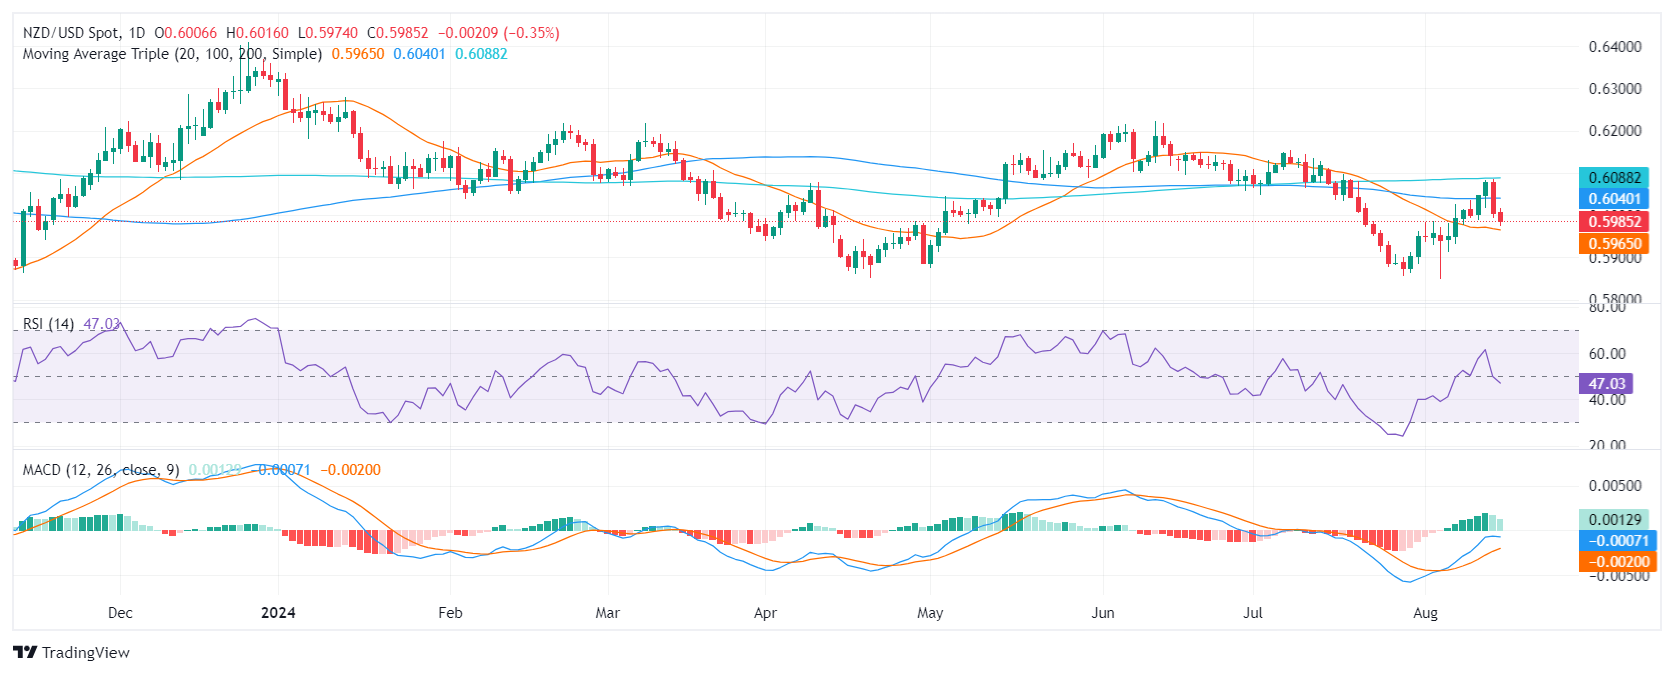
In Thursday's session, the NZD/USD pair declined to 0.5985, extending its losing streak to two consecutive sessions. The pair has been trading within a narrow range between the 200-day Simple Moving Average (SMA) and the 20-day SMA which are serving as support and resistances.
On the daily chart, the Relative Strength Index (RSI) is currently around 49, but points down while the MACD is showing decreasing green bars, signaling decreasing bullish momentum. This suggests that the selling pressure is increasing and a potential reversal could be on the horizon.
NZD/USD daily chart

On the daily chart, the NZD/USD pair is facing immediate support at 0.5980. A break below this level could open the door for a deeper correction towards 0.5960 and 0.5930 (20-day SMA). On the upside, resistance lies at 0.6000, 0.6040(100-day SMA) and 0.6100 (200-day SMA). Traders should monitor any brakes above or below the mentioned SMAs as they could trigger sharp movements.