EUR/GBP Price Analysis: Mixed signals from indicators, eyes on bullish crossover
- EUR/GBP marginally rose to 0.8520 after two sessions of losses.
- Technical indicators present a neutral outlook for the short term.
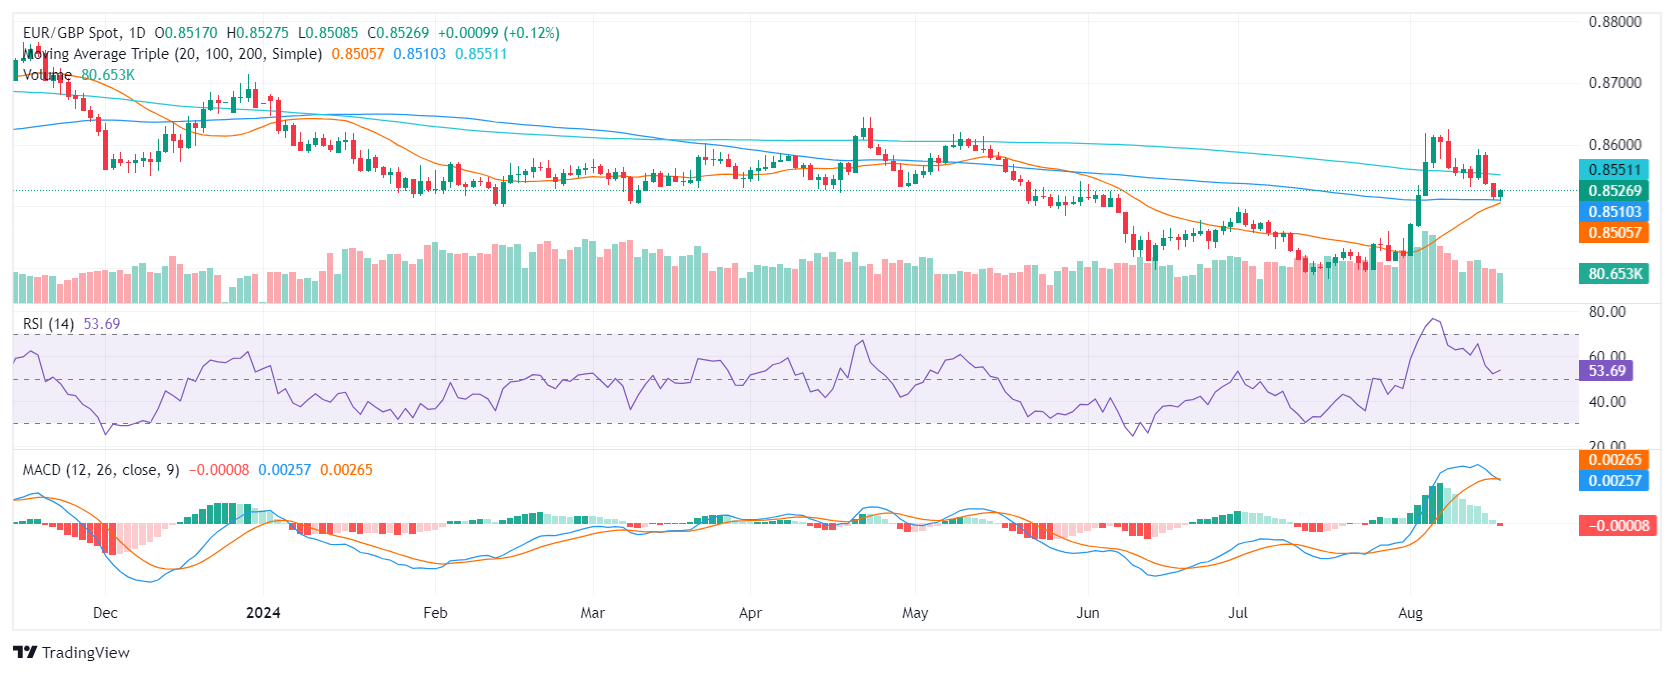
- Traders should track a potential bullish crossover between the 20 and 100-day SMA at around 0.8500.
Monday's trading saw the EUR/GBP pair fluctuate within a narrow range, with a marginal rise to 0.8520. This movement followed a two-day losing streak for the pair.
The EUR/GBP pair suggests a mix of bullish and bearish signals. The Relative Strength Index (RSI) is currently at 53, indicating a slight upward trend in buying pressure. However, the Moving Average Convergence Divergence (MACD) has printed a fresh red bar, suggesting a potential shift towards bearish momentum. Volume patterns have been mixed, with recent sessions exhibiting lower volume compared to large spikes observed earlier in the month.
EUR/GBP daily chart

The EUR/GBP pair has been consolidating within a range of 0.8500-0.8550 for the last few sessions. A breakout above 0.8550 could indicate a potential bullish trend, while a break below 0.8500 may increase the likelihood of further downward movement. Key support levels to watch include 0.8450 and 0.8400, while resistance levels to consider include 0.8580 and 0.8600.
A bullish catalyst might be a crossover about to be completed between the 20 and 100-day Simple Moving Averages (SMA) at around 0.8500. This could firstly propel the pair upwards as well as build support around the mentioned psychological level.