Silver Price Analysis: XAG/USD bounces off 21-DMA above $24.00 after the biggest daily slump in five weeks
- Silver Price picks up bids to pare the biggest daily loss since June 20.
- Clear downside break of three-week-old rising trend line, looming bear cross on MACD lure XAG/USD sellers.
- Short-term DMAs can test Silver bears ahead of $23.00 support confluence; XAG/USD recovery remains elusive blow $24.70.
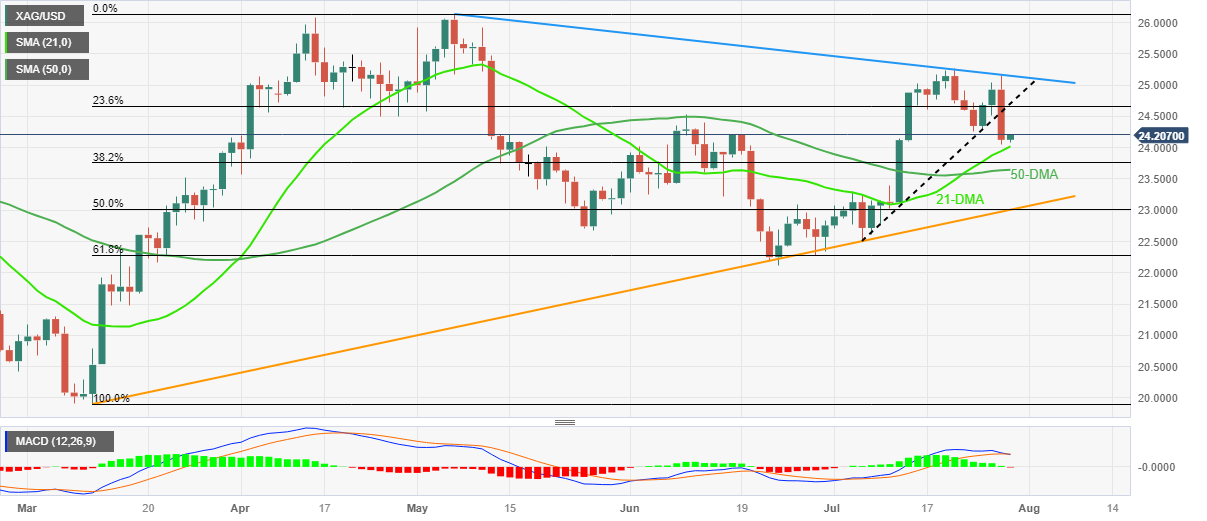
Silver Price (XAG/USD) consolidates the previous day’s heavy losses by printing mild gains around $24.20 during early Friday morning in Asia. In doing so, the XAG/USD bounces off the 21-DMA while reversing from the lowest level in a fortnight.
Despite the latest recovery, the XAG/USD stays on the bear’s radar as it stays beneath the previous support line stretched from July 06 amid an impending bear cross on the MACD.
It’s worth noting that the 23.6% Fibonacci retracement of the Silver Price run-up during the March-May period joins the support-turned-resistance line to highlight $24.70 as the short-term key upside hurdle.
Following that, a downward-sloping resistance line from early May, near $25.20 at the latest, will be crucial to watch for the XAG/USD bulls before challenging the yearly top marked in May, close to $26.15.
On the flip side, a daily close beneath the 21-DMA support of $24.00 isn’t an open invitation to the Silver bears as the 50-DMA can challenge the downside near $23.60.
Above all, a convergence of an upward-sloping trend line from March 10 and a 50% Fibonacci retracement, close to $23.00 by the press time, appears a tough nut to crack for the XAG/USD bears.
Silver Price: Daily chart

Trend: Limited downside expected