Gold Price Forecast: XAU/USD falls below the 100-SMA as US yields surge
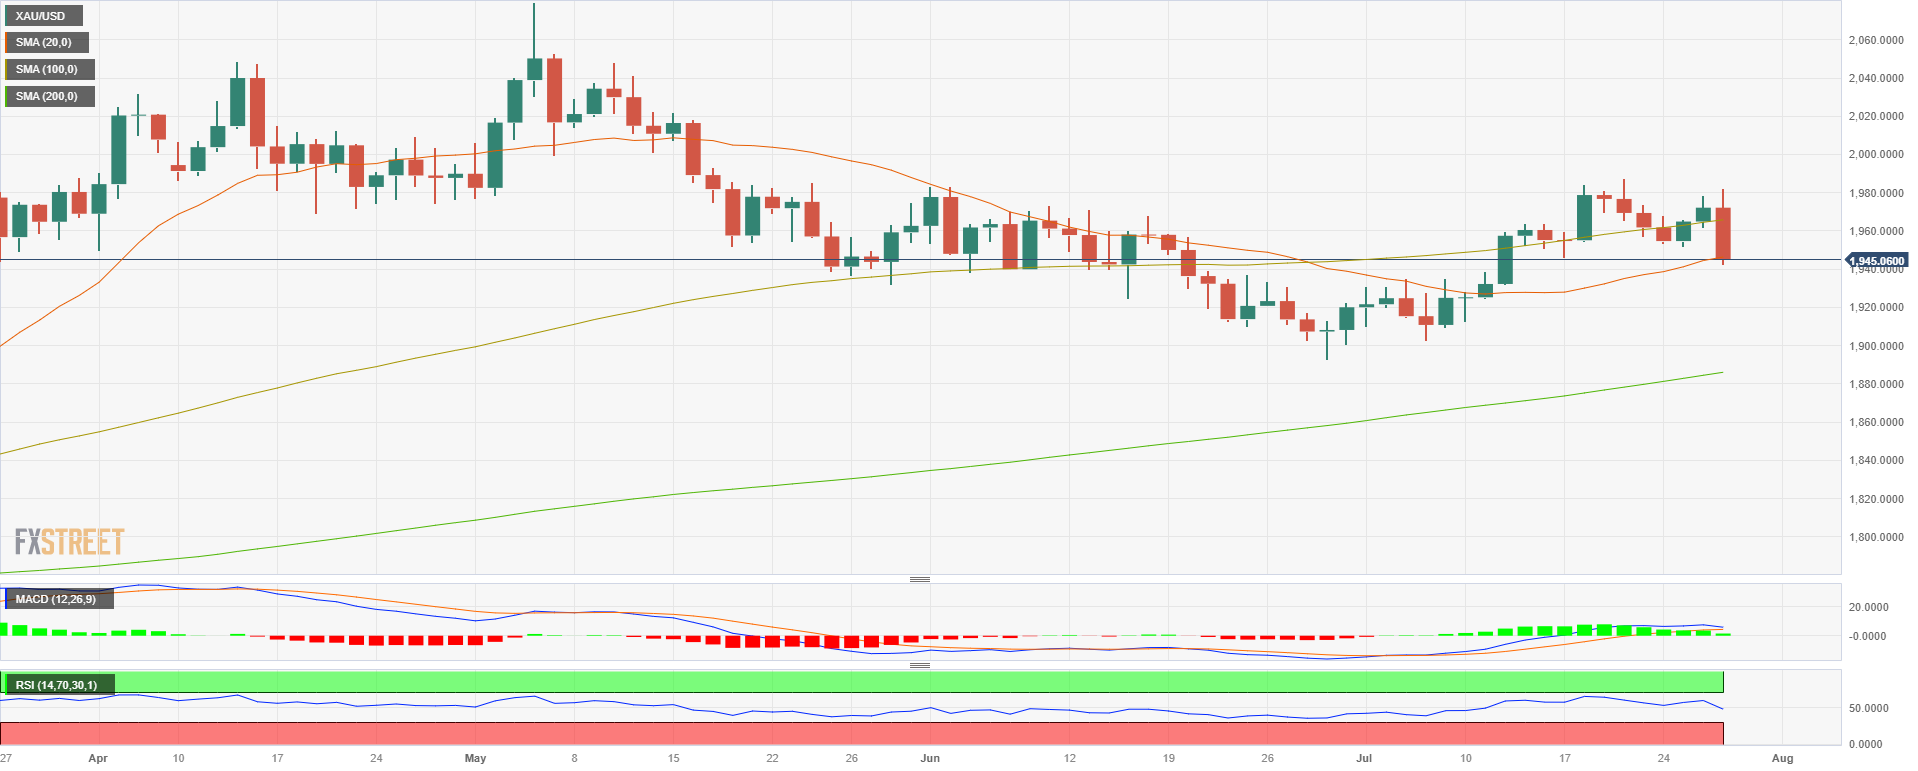
- XAU/USD fell more than 1.40% on Thursday and lost the 100 and 20-day SMA near $1,940.
- Robust US data fueled hawkish bets on the Fed, increasing US yields.
- The USD DXY jumped back above 101.00.
On Thursday, non-yielding precious metals faced selling pressure amid strong data from the US, which made markets start to place bets on a possible hike by the Federal Reserve (Fed) in September, which increased US treasury yields.
It's worth mentioning that Jerome Powell claimed on Wednesday that in September, the Fed may hike or pause, adding that the decision will depend solely on incoming data. In that sense, on Thursday, the US reported that the Q2 Gross Domestic Product (GDP) expanded at a higher annualised pace than expected by increasing monthly Durable Goods Orders in June. In addition, Jobless Claims in the third week of July rose but were lower than anticipated hinting that the US economy is holding firm and may give the Fed room to deliver an additional hike.
As a reaction, US Treasury yields, which could be seen as the opportunity cost of holding Gold, increased across the board, applying pressure on the XAU/USD. The 2-year rate rose to 4.92%, the 5-year yield to 4.23%, and the 10-year to 4.00%, with all three seeing more than 1% increases.
XAU/USD Levels to watch
The daily chart suggests that the technical outlook for the XAU/USD has turned bearish for the short term. The Relative Strength Index (RSI) collapsed into negative territory, while the Moving Average Convergence Divergence (MACD) prints fading green bars, suggesting that the bears are in command. In addition, the price has fallen below the 20 and 100-day Simple Moving Averages (SMAs).
Support levels: $1,930, $1,915, $1,900.
Resistance levels: $1,945 (20-day SMA), $1,965 (100-day SMA), $1,980.
