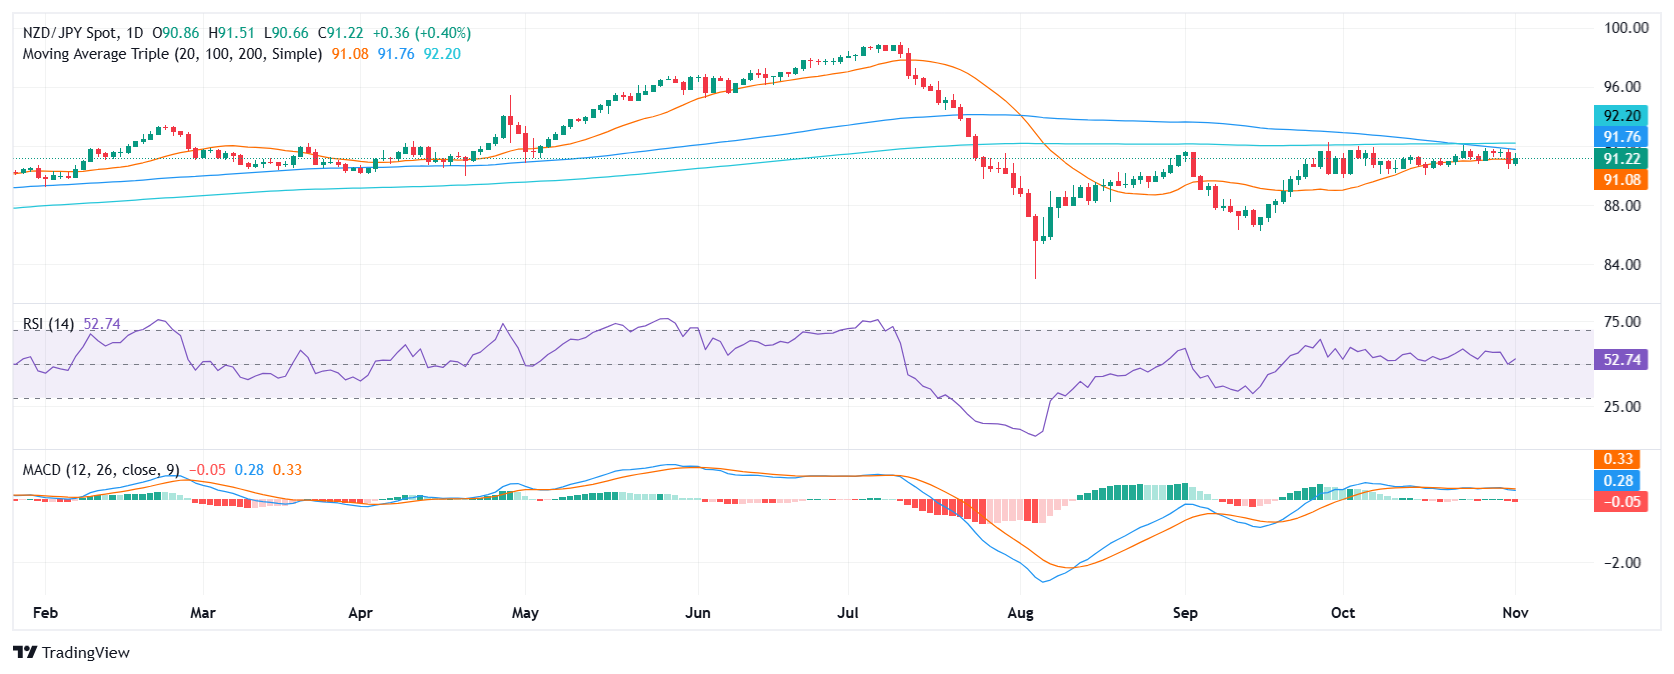
NZD/JPY Price Analysis: Selling pressure intensifies, 20-day SMA under attack
- NZD/JPY extended its decline on Monday, dropping to 90.90.
- Technical indicators suggest a bearish outlook, with increasing selling pressure and a declining RSI.
- The 20-day SMA is the last barrier against the sellers.
The NZD/JPY’s recent sideways movement seems to be ending, as the pair resumed its decline and fell slightly below the 20-day Simple Moving Average (SMA), below 91.00 on Monday.
The Moving Average Convergence Divergence (MACD) indicator shows rising red bars, indicating increasing bearish momentum while the Relative Strength Index (RSI) is below 50, with a declining slope, also suggesting a bearish outlook.
The selling pressure is likely to continue, with potential support levels at 90.50, 90.00, and 89.50. If the pair breaks below 90.50, it could signal further decline. On the other hand, a close above 91.50 resistance could indicate a trend reversal. However, the overall outlook remains bearish, as the MACD and RSI indicators suggest strong selling pressure. In addition, the 100-day SMA is looming near the 20-day average and in case of completing a bearish crossover more selling pressure should be expected.
NZD/JPY daily chart
