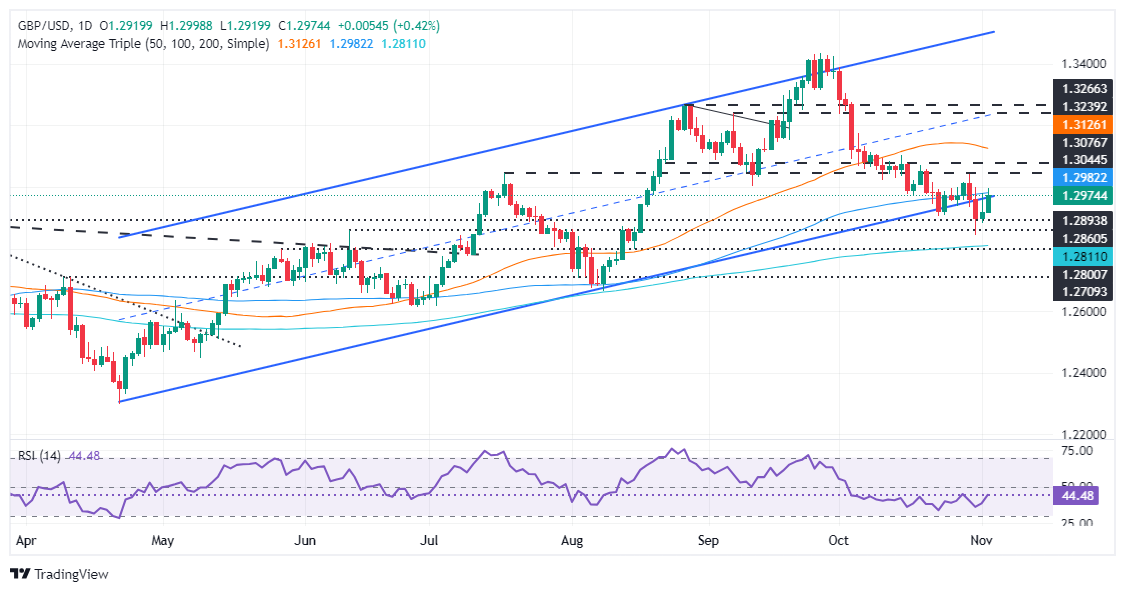
GBP/USD Price Forecast: Sterling gains yet fails to clear 1.3000 ahead of US Election
- GBP/USD approaches 1.3000 but remains capped by 100-day SMA.
- A close above 1.3000 may open path to 1.3042 and higher targets.
- Failure to break resistance could lead to 1.2884 support test and further declines.
The Pound Sterling trimmed some of last week's losses against the Greenback and registered gains of over 0.46% ahead of a busy economic schedule featuring US Presidential Elections. At the time of writing, the GBP/USD trades at 1.2971 after rebounding off daily lows of 1.2945.
GBP/USD Price Forecast: Technical outlook
After falling below September’s 11 swing low of 1.3001, the GBP/USD turned neutral to bearish bias, clearing on its way to the 50-day Simple Moving Average (SMA). During the day, the pair hit a daily high of 1.2998, but they could not crack 1.3000. The 100-day SMA at 1.2979 pulled the exchange rate lower.
For a bullish resumption, buyers must surpass 1.3000. Once cleared, the next stop would be the October 30 high at 1.3042, followed by the October 21 peak at 1.3057 ahead of 1.3100.
Conversely, if GBP/USD achieves a daily close below the 100-day SMA, further weakness could drive the exchange rate toward the November 1 low of 1.2884. A breach of the latter will expose October’s 31 swing low of 1.2843 before testing the 200-day SMA at 1.2809.
GBP/USD Price Chart – Daily

British Pound PRICE Today
The table below shows the percentage change of British Pound (GBP) against listed major currencies today. British Pound was the strongest against the US Dollar.
| USD | EUR | GBP | JPY | CAD | AUD | NZD | CHF | |
|---|---|---|---|---|---|---|---|---|
| USD | -0.61% | -0.44% | -0.17% | -0.26% | -0.68% | -0.17% | -0.53% | |
| EUR | 0.61% | 0.14% | 0.02% | -0.05% | 0.24% | 0.05% | -0.32% | |
| GBP | 0.44% | -0.14% | -0.37% | -0.19% | 0.10% | -0.09% | -0.46% | |
| JPY | 0.17% | -0.02% | 0.37% | -0.09% | 0.05% | 0.22% | -0.05% | |
| CAD | 0.26% | 0.05% | 0.19% | 0.09% | -0.21% | 0.08% | -0.27% | |
| AUD | 0.68% | -0.24% | -0.10% | -0.05% | 0.21% | -0.19% | -0.56% | |
| NZD | 0.17% | -0.05% | 0.09% | -0.22% | -0.08% | 0.19% | -0.36% | |
| CHF | 0.53% | 0.32% | 0.46% | 0.05% | 0.27% | 0.56% | 0.36% |
The heat map shows percentage changes of major currencies against each other. The base currency is picked from the left column, while the quote currency is picked from the top row. For example, if you pick the British Pound from the left column and move along the horizontal line to the US Dollar, the percentage change displayed in the box will represent GBP (base)/USD (quote).