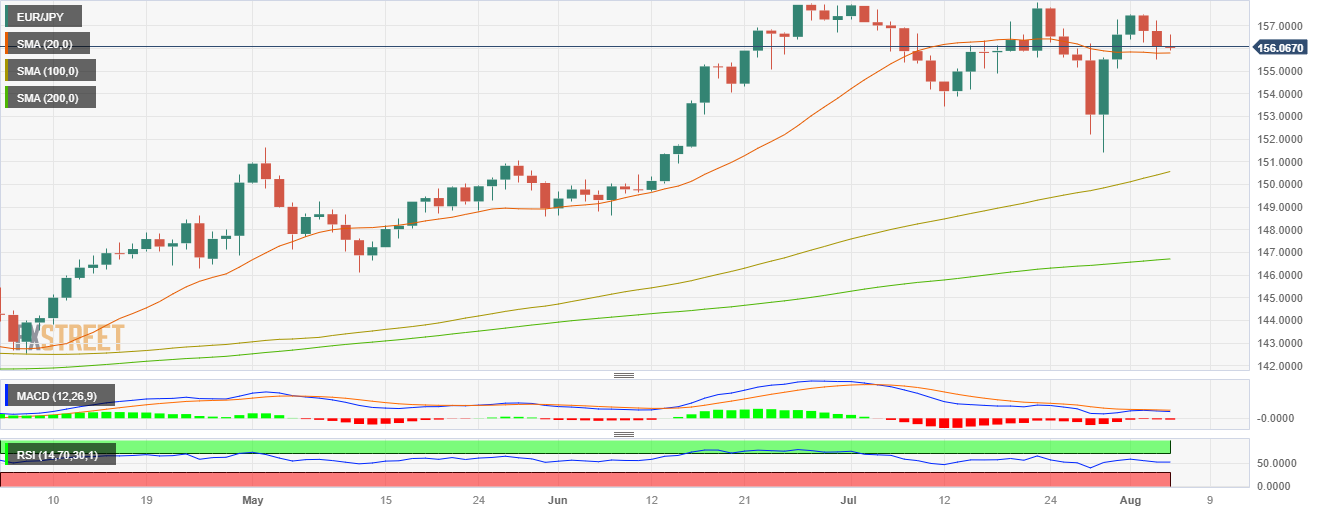
EUR/JPY closes the week neutral above the 20-day SMA
- EUR/JPY bulls defended the 20-day SMA, and the cross established itself above 156.00.
- Factory orders from June unexpectedly rise by 7%.
- BoJ’s hawkish signals and rising Japanese yields may limit the pair’s gains.
On Friday, the EUR/JPY traded above the 156.00 zone, boosted by a stronger Euro following industrial data from June but still, bullish momentum is limited. On the other hand, the Yen traded mixed against its rivals and its losses are cushioned by the Bank of Japan flashing hawkish signals.
Europe reported robust industrial data but soft Retail sales. Factory Orders in June jumped 7% while markets expected a 2% decline while sales in the Retail sectors declined by 0.3%, a decline higher than the 0.2% expected by the markets. In Friday’s session, the EUR traded with gains against most of its rivals, including the USD, AUD, JPY and GBP.
On the Yen’s side, is Japanese currency seems to be gaining traction on the back of Bank of Japan (BoJ) comments which stated that the benchmark 10-year Japanese Government Bonds (JGB) will widen from 0.5% to 1.0% which pushed Japanse yields to their highest levels since 2014. In that sense, markets may anticipate a potential pivot by the BoJ, but the Yen will remain vulnerable as long as the bank doesn’t take action.
EUR/JPY Levels to watch
As per the daily chart, the technical outlook for EUR/JPY is shifting towards neutral to bearish, with signs of bullish exhaustion becoming evident. The Relative Strength Index (RSI) displays a negative slope above its midline, while the Moving Average Convergence Divergence (MACD) exhibits fading green bars. Additionally, the pair is above the 20,100,200-day SMAs, suggesting that the outlook on the bigger picture favours the EUR.
Support levels: 155.75, 155.00, 154.00.
Resistance levels: 156.50, 157.00, 157.50.
EUR/JPY Daily chart
