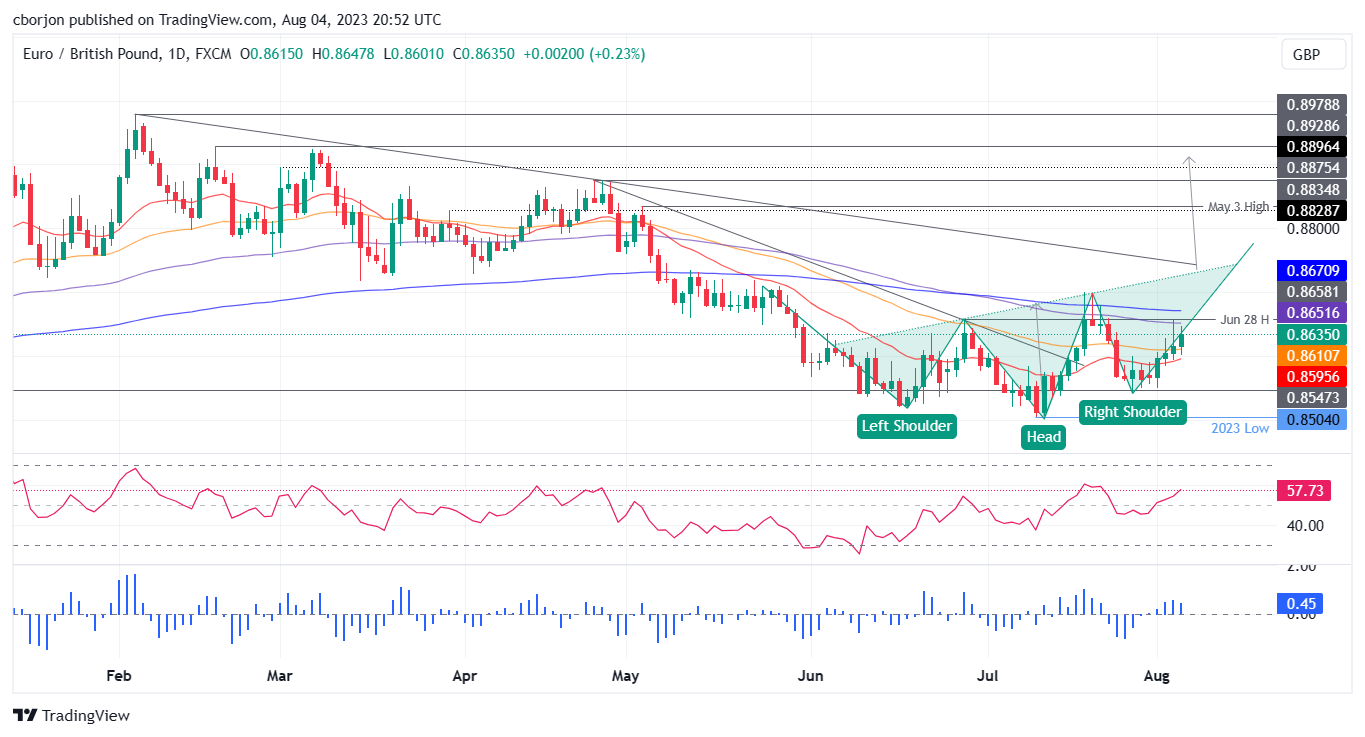
EUR/GBP Price Analysis: Gains traction as an inverted head-and-shoulders pattern looms
- EUR/GBP gains for four consecutive days, up 0.81% for the week, trading at 0.8635 but failing to break through the 100-day EMA at 0.8655.
- The Bank of England’s 25 bps rate hike influences the pair’s movement, capping further advance.
- Technical outlook reveals an inverted head-and-shoulders chart pattern, targeting 0.8900.
EUR/GBP rallies for the fourth straight day, set to finish the week with gains of 0.81% but failed to crack the 100-day Exponential Moving Average (EMA) of 0.8655, tested on Thursday. The Bank of England’s (BoE) 25 bps rate hike was the reason that capped the EUR/GBP advance, though the EUR/GBP is trading sideways, slightly tilted to the upside. At the time of writing, the EUR/GBP exchanges hands at 0.8635, a gain of 0.23%.
EUR/GBP Price Analysis: Technical outlook
The daily chart portrays the pair forming an inverted head-and-shoulders chart pattern, but EUR/GBP’s price action has failed to decisively break above the 100 and 200-day EMAs at 0.8651 and 0.8671. Nevertheless, further validation is needed, as the EUR/GBP must break above 0.8740/50.
Once that cleared, the EUR/GBP first resistance would be 0.8800. A breach of the latter will expose the May 3 high at 0.8835, followed by the inverted head-and-shoulders minimum profit target of 0.8900. On the flip side, if EUR/GBP drops below the 50-day EMA at 0.8610, that could pave the way for further losses.
The EUR/GBP first support would be 0.8600, closely followed by the 20-day EMA at 0.8595. Once those levels are broken, the next support would emerge at the July 27 daily low of 0.8544, followed by the July 11 daily low of 0.8504.
EUR/GBP Price Action – Daily chart
