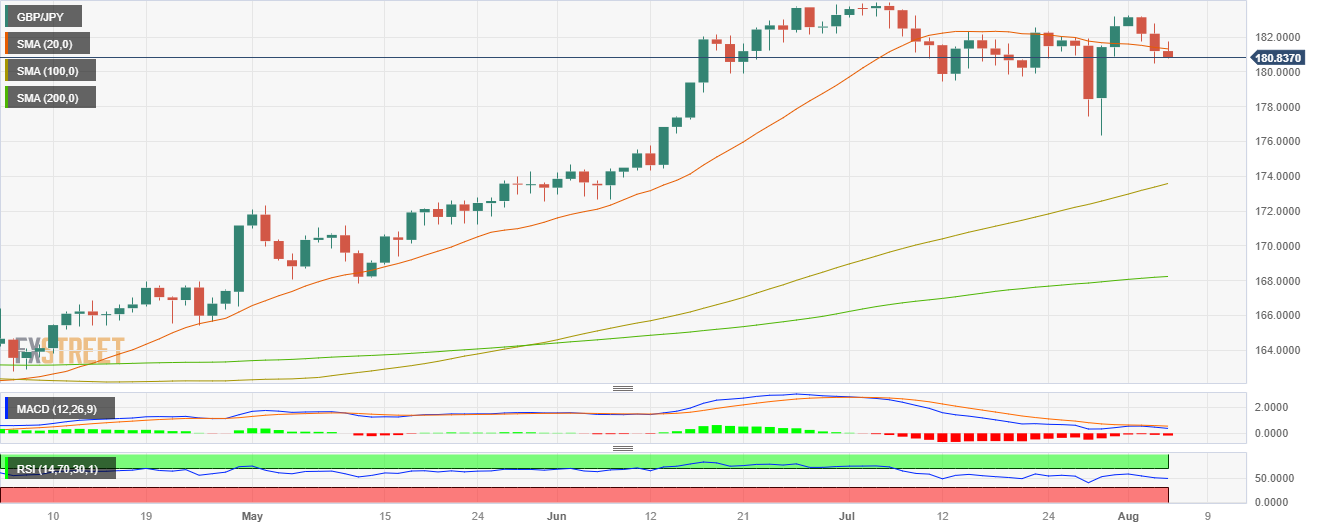
GBP/JPY Price Analysis: Bulls give up, and bears retake the 20-day SMA
- GBP/JPY retreated towards the 181.00 area and cleared most of its weekly gains.
- Investors continue to digest BoE’s decision on Thursday.
- Governor Ueda committed that the BoJ will be more flexible with the 10-year JGB.
On Friday, the JPY traded mixed against most of its rivals, mainly because of Governor Ueda’s from the Bank of Japan (BoJ) on widening the tolerance of the 10-year JGB. On the other hand, the GBP trades flat after the Bank of Englan monetary policy decision on Thursday.
The GBP traded mixed agains most of its rivals following Thursday’s BoE decision. Overall, rates were hiked by 25 basis points as expected. The bank no longer expects a recession but noted that the monetary policy is now “impacting " economic activity. Regarding inflation, the BoE forecasts the Consumer Price Index (CPI) to be below 5% by year-end and below 2% by 2025. Still, the question to be asked is on whether the bank can achieve a significant drop in prices without a recession.
As for now, according to the World Interest Rates (WIRP) tool, markets are seeing 25 bps hikes in September and December, followed by an additional increase in Q1 of 2024 which would see the terminal rate at 5.75%.
On the Yen’s side, is Japanese currency seems to be gaining traction on the back of Bank of Japan (BoJ) comments which stated that the benchmark 10-year Japanese Government Bonds (JGB) will widen from 0.5% to 1.0%, which pushed Japanese yields to their highest levels since 2014. In that sense, markets may anticipate a potential pivot by the BoJ, but the Yen will remain vulnerable if the bank doesn’t take action.
GBP/JPY Levels to watch
Per the daily chart, the technical outlook for GBP/JPY is shifting towards neutral to bearish, with signs of bullish exhaustion becoming evident. The Relative Strength Index (RSI) displays a negative slope above its midline, while the Moving Average Convergence Divergence (MACD) exhibits negative red bars. Moreover, the pair is below the 20-day Simple Moving Average (SMA), but above the 100 and 200-day SMAs, indicating that the buyers still hold momentum on the bigger picture, dominating the sellers.
Support levels: 179.85, 179.00, 178.00.
Resistance levels: 181.25 (20-day SMA), 182.00, 183.00.
GBP/JPY Daily chart
