WTI Price Analysis: WTI jumps to multi-month high amid USD weakness
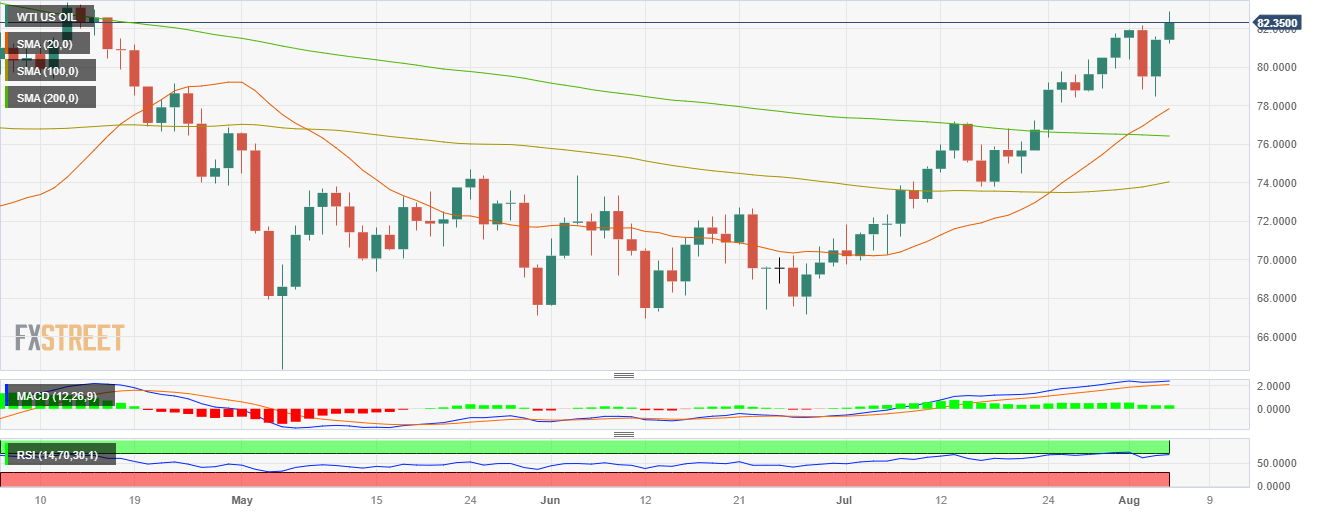
- WTI rose above $83.00 to its highest point since mid-April, seeing more than 1.70% gains.
- The WTI barrel will set a sixth consecutive winning streak, and indicators flash overbought conditions.
- The USD weakened following NFPs figures revealing a deceleration of job creation in July.
At the end of the week, the West Texas Intermediate (WTI) barrel surged to a daily high above $83.00 for the first time since April. Expectations of Oil production cuts by the Saudis and the weakness of the US Dollar are the main responsible for the upwards trajectory of the black gold.
From the US side, mixed data has been released. On the one hand, the US Bureau of Labor Statistics released its Nonfarm Payrolls, which saw the US economy adding 187,000 jobs in July, lower than the expected 200,000 but higher than the previous figure of 185,000. Additionally, the Unemployment Rate came in at 3.5%, lower than the consensus and last figure of 3.6%. On the other hand, the Average Hourly Earnings came in at 4.4% YoY, higher than the 4.2% expected.
As a reaction, the USD weakened due to dovish expectations on the Federal Reserve (Fed) following the deceleration of the pace of job creation, and investors seem to disregard the wage increase. It's worth noticing that higher rates tend to be negatively correlated with Oil prices, as a more aggressive monetary policy tends to cool down economies, so dovish bets on the Fed and a weaker USD favour the WTI’s prices.
As Jerome Powell highlighted that ongoing decisions depend on data, the focus now shifts to next week's Consumer Price Index (CPI) figures from the US from July, which is expected to have decelerated.
WTI Levels to watch
The daily chart analysis indicates a bullish outlook the WTI in the short term. The Relative Strength Index (RSI) is above its midline in positive territory, with a positive slope, aligning with the positive signal from the Moving Average Convergence Divergence (MACD), displaying green bars, and reinforcing the strong bullish sentiment. Moreover, the pair is comfortably above the 20,100,200-day Simple Moving Averages (SMAs), indicating that the bulls command the broader picture.
That being said, both the RSI and MACD are near overbought conditions, so a technical correction shouldn’t be ruled out in the following sessions.
Resistance levels: $84.00,$85.30,$86.00.
Support levels: $79.50, $79.00,$78.00 (20-day SMA).
WTI Daily chart
