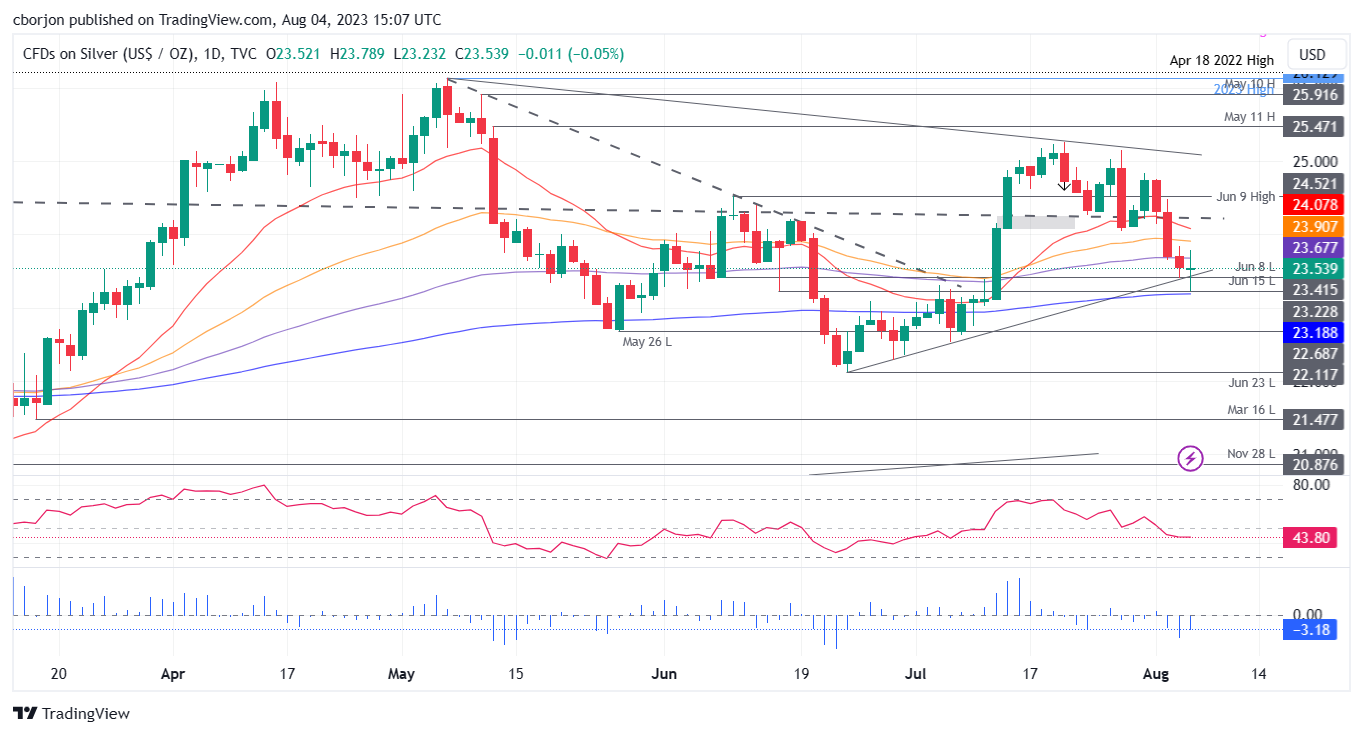
Silver Price Analysis: XAG/USD recovers some ground as doji emerges and is subject to remaining subdued
- Silver (XAG/USD) stages a modest recovery after July’s US jobs data missed estimates, trading at $23.57, bouncing off the 200-day EMA at $23.18.
- Technical outlook shifts to neutral-upward bias, as the metal remains above the 200-day EMA and July 6 low of $22.53.
- Key resistance lies at the 100-day EMA at $23.67, followed by the 50 and 20-day EMAs at $23.90 and $24.07 respectively. Support is found at the 200-day EMA and $23.00 mark.
Silver price is staging a slight recovery on Friday after US jobs data for July missed estimates, spurring XAG/USD’s bounce at around the 200-day Exponential Moving Average (EMA) at $23.18 a troy ounce as US Treasury bond yields tank. The XAG/USD is exchanging hands at $23.57 after hitting a daily low of $23.23.
XAG/USD Price Analysis: Technical outlook
From a technical perspective, XAG/USD bias shifted to neutral biased as long as buyers keep prices from diving below the 200-day EMA and above the July 6 low of $22.53. Even though XAG/USD is trimming some losses, It remains subject to further selling pressure, with the 100-day EMA at $23.67 capping any Silver’s rallies and the Relative Strength Index (RSI) indicating that sellers remain in charge.
If XAG/USD reclaims the 100-day EMA, that will put into play two more daily EMAs acting as resistance, the 50 and the 20-day EMAs, each at $23.90 and $24.07, respectively. Conversely, buyers’ failure at $23.67 could send the white metal slumping toward the 200-day EMA, ahead of challenging the $23.00 figure.
XAG/USD Price Action – Daily chart
