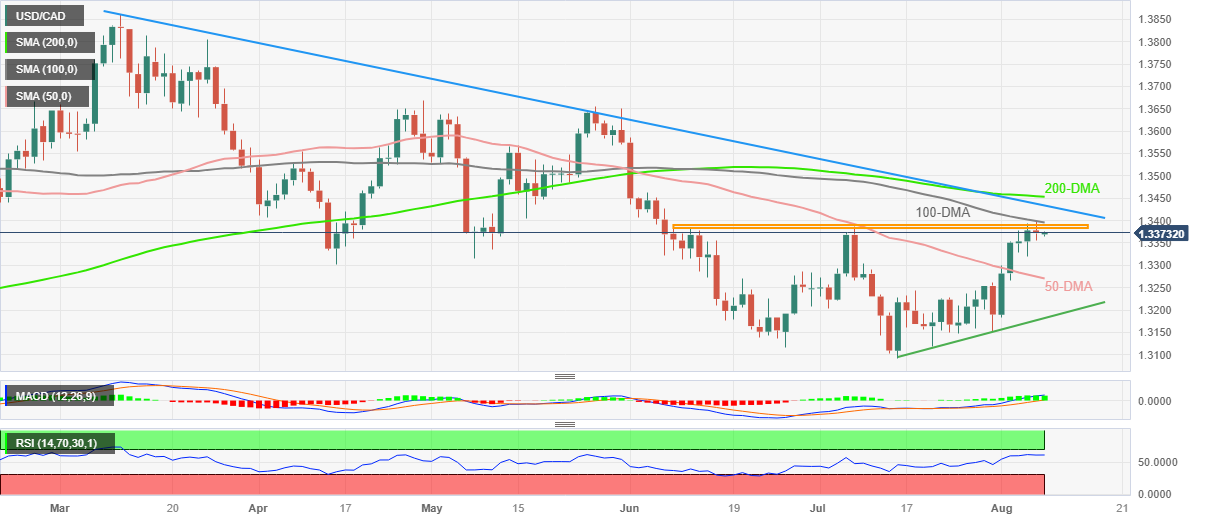
USD/CAD Price Analysis: Retreats from 100-DMA surrounding 1.3400 but stays on bull’s radar
- USD/CAD remains pressured after reversing from two-month high.
- Clear upside break of 50-DMA joins upbeat oscillators to defend Loonie pair buyers.
- Tops marked since early June, 100-DMA guard immediate upside.
USD/CAD stays depressed near 1.3370 after reversing from the highest level in two months the previous day. That said, the Loonie pair snapped a four-day uptrend the previous day before posting a lackluster start to the Asian session on Tuesday.
USD/CAD took a U-turn from the 100-DMA and closed beneath a two-month-old horizontal resistance to lure the Loonie (CAD) buyers. However, the bullish MACD signals for the pair and the upbeat RSI (14) line, not overbought, suggests further upside of the quote.
Hence, USD/CAD may witness a slower grind toward the north wherein the aforementioned horizontal resistance zone surrounding 1.3390 and the 100-DMA hurdle of around 1.3400 could restrict the short-term upside of the Loonie pair.
Following that, a downward-sloping resistance line from early March and the 200-DMA, respectively near 1.3435 and 1.3455, will act as the final defense of the USD/CAD bears.
On the contrary, the monthly lows of May and April, close to 1.3315 and 1.3300 in that order, can lure the short-term sellers of the USD/CAD pair ahead of the 50-DMA level of 1.3270.
It’s worth noting, however, that a daily closing below the 50-DMA support of 1.3270 will make the USD/CAD pair vulnerable to drop towards a three-week-old rising support line near 1.3180.
USD/CAD: Daily chart

Trend: Further upside expected