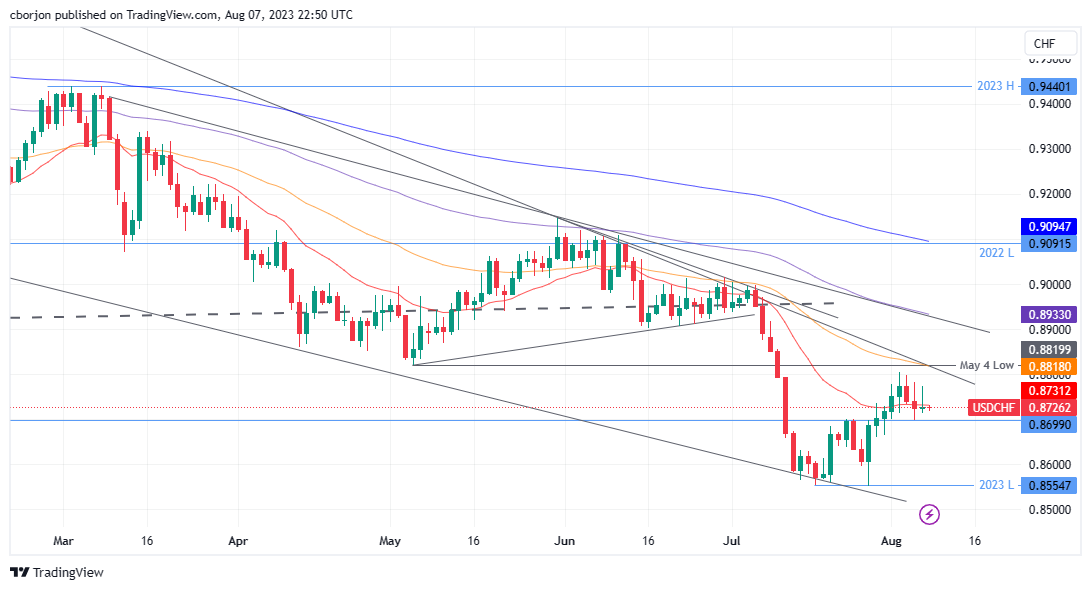
USD/CHF Price Analysis: Seesaws around the 20-day EMA, stays above 0.8700
- USD/CHF printed a ‘bearish-harami’ candlestick pattern but failed to extend its losses past the last week’s low.
- Monday’s ‘gravestone-doji’ indicates traders’ uncertainty regarding a further downward move.
- USD/CHF key support emerges at 0.8699, while the first resistance lies at 0.8731.
USD/CHF held to minimal gains of 0.03% on Monday, seesaws above/below the 20-day Exponential Moving Average (EMA) of 0.8731 as the Asian session begins. Nevertheless, the USD/CHF remains in a downtrend, and exchanges hands at 0.8726, down 0.01%.
USD/CHF Price Analysis: Technical outlook
After forming a ‘bearish-harami’ candlestick chart pattern, the USD/CHF resumed its downtrend last Thursday, but Monday’s price action forming a ‘gravestone-doji’ portrays traders’ indecision about extending its losses toward last week’s low of 0.8699.
If USD/CHF drops below the latter, the pair might extend its losses toward the year-to-date (YTD) low of 0.8554, threatening to extend its plunge toward the 0.8500 figure. Conversely, if USD/CHF buyers reclaim the 20-day EMA, that could pave the way for further upside.
First resistance would emerge at the 0.8800 figure. Once buyers conquer that level, up next would be the May 4 low-turned resistance at 0.8819, followed by the 0.8900 mark.
USD/CHF Price Action – Daily chart
