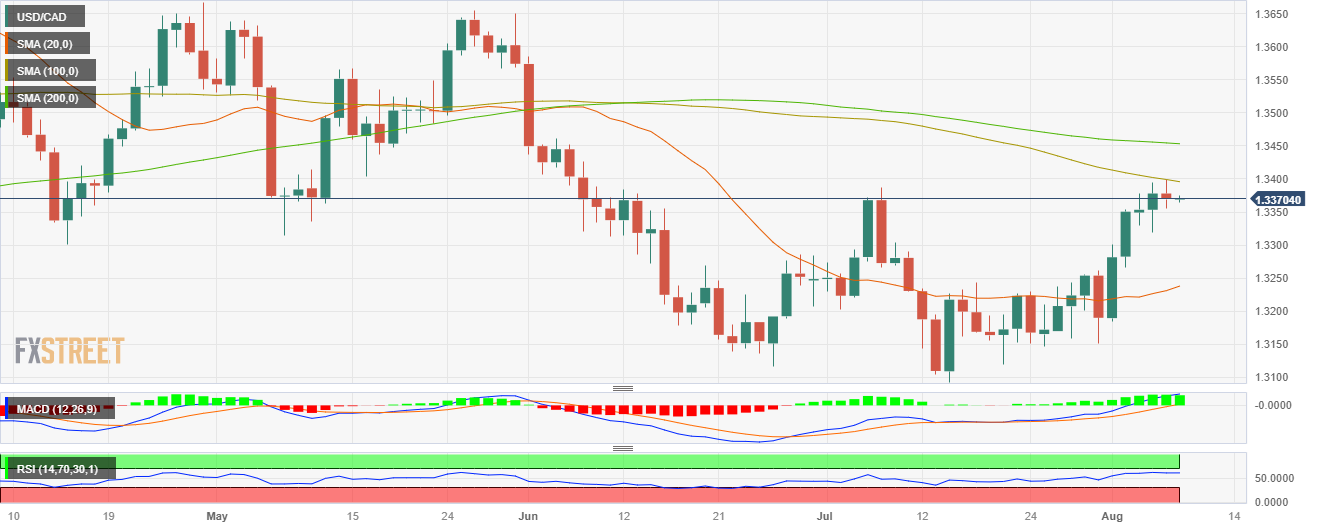
USD/CAD closes flat around the 1.3370 area on Monday
- The USD/CAD closed neutral, just above its opening price at 1.3370 after hitting a daily high of 1.3399.
- The USD regained ground while markets continued to assess labour market data from last Friday.
- Investors eagerly await US Thursday's inflation figures for guidance.
The USD/CAD closed flat at the 1.3370 zone after getting rejected at the 100-day Simple Moving Average (SMA) of 1.3395 at the end of Monday’s session. On the one hand, the US Dollar strengthened on the back of rising US yields while lower Oil prices limited the CAD’s advance.
At the start of the week, no relevant data was released, and markets continued to assess Friday’s Nonfarm Payrolls (NFPs) from the US in July. The data showed that job creation slowed and wages increased, but markets dumped the USD on the lower-than-expected NFPs. During the session, the Greenback re-gained ground against its rivals as the US Treasury yields recovered, with the 10-year rate jumping more than 1% to 4.09% after significantly declining on Friday and pushing the pair upwards.
All eyes are now on Consumer Price Index (CPI) figures from July, where markets foresee the headline figure accelerating but the core measure decelerating.
On the CAD’s front, the Canadian calendar had nothing relevant to offer. The decrease of the West Texas Intermediate (WTI) and Brent barrels added pressure over the Loonie through the session.
USD/CAD levels to watch
Observing the daily chart, it is apparent that USD/CAD is experiencing a neutral to bearish trend as the bulls struggle to maintain their momentum. The Relative Strength Index (RSI) has a negative slope above its midline, while the Moving Average Convergence (MACD) prints lower green bars. Moreover, the pair is above the 20-day Simple Moving Average (SMA) but below the 100 and 200-day SMAs, indicating that despite still being some light for the bulls, the bears have the upper hand in the broader context.
Support levels: 1.3330, 1.3315, 1.3300.
Resistance levels: 1.3395 (100-day SMA), 1.3440, 1.3450 (200-day SMA).
USD/CAD Daily chart
