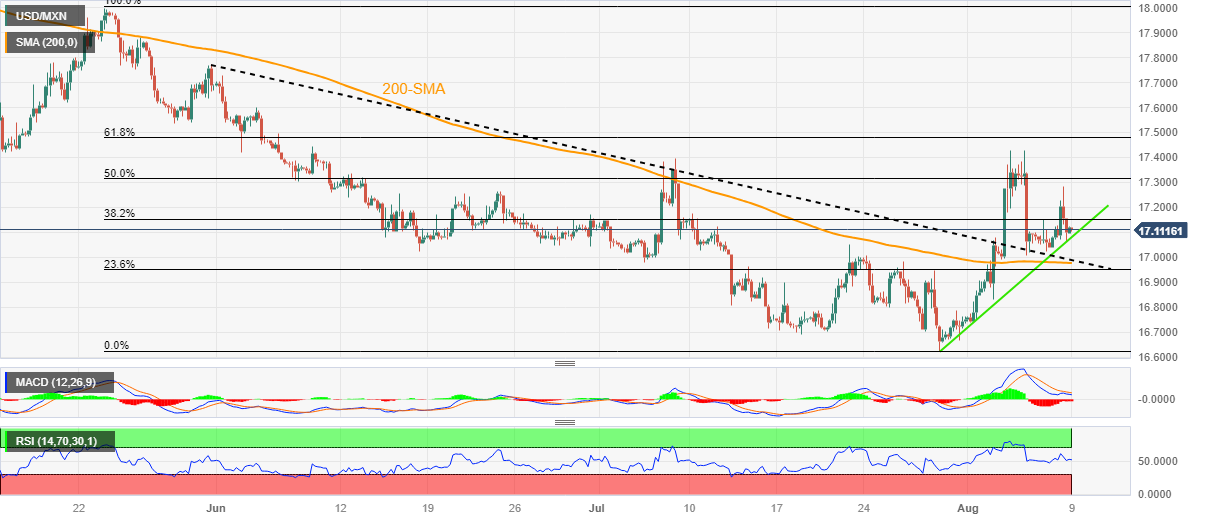
USD/MXN Price Analysis: Peso bounces off adjacent support line to stay above 17.00, Mexico inflation cues eyed
- USD/MXN defends the previous day’s rebound from eight-day-old rising support line ahead of Mexico inflation numbers for July.
- Looming bull cross on MACD, steady RSI (14) line near 50.00 keep Mexican Peso sellers hopeful.
- Convergence of 200-SMA, previous resistance line from late May appears a tough nut to crack for USD/MXN bears.
USD/MXN clings to mild gains around 17.11 as it defends late Tuesday’s corrective bounce off a one-week-long rising support line amid a sluggish start to Wednesday’s trading. In doing so, the Mexican Peso (MXN) justifies the market’s cautious mood ahead of Mexico’s headline inflation numbers for July, scheduled for release at noon per the GMT today.
Also read: USD/MXN advances amid global risk-aversion and strong US Dollar
Apart from the immediate support line, an impending bull cross on the MACD and steady RSI (14), as well as the broad US Dollar strength amid the risk-off mood, also favors the USD/MXN buyers.
However, a descending resistance line from Friday, around 17.26 by the press time, guards the immediate recovery of the Mexican Peso pair.
Following that, the monthly high of 17.42 will be crucial to break for the USD/MXN bulls to keep the reins.
On the contrary, a downside break of the aforementioned support line, near 17.05 by the press time, isn’t an open invitation to the USD/MXN bears. The reason could be linked to the existence of convergence of the 200-SMA and the previous resistance line stretched from May 31, around 16.97 by the press time.
USD/MXN: Four-hour chart

Trend: Further recovery expected