Silver Price Analysis: XAG/USD struggles at 200-day EMA, bearish signals suggest potential downside
- XAG/USD fails to cling above key 200-day EMA, hints at a downside
- An inverted hammer formation underscores a bearish outlook.
- Break past the 200-day EMA could prompt a bullish scenario.
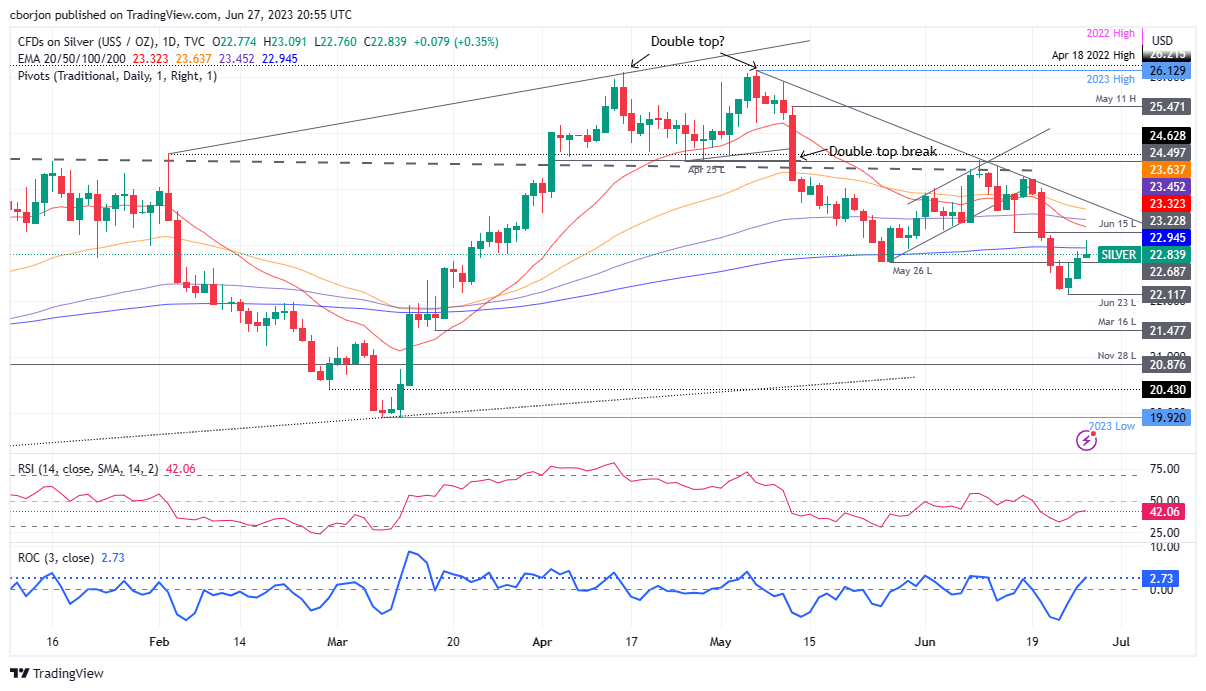
Silver price recovered some ground and tested the 200-day Exponential Moving Average (EMA) but failed to cling above the latter, opening the door for further downside. Hence, Wednesday’s price action is set to form an inverted hammer, preceded by an uptrend, warranting downward action. At the time of writing, the XAG/USD is trading at $22.87, clinging to its gains of 0.47%.
XAG/USD Price Analysis: Technical outlook
After piercing the 200-day EMA at $22.94 and reaching a new weekly high of $23.09, the XAG/USD retraced most of its gains, tumbling back below two key resistance areas: the 1.2300 figure and the 200-day EMA. In addition, the Relative Strength Index (RSI) indicator is still bearishly biased, while the three-day Rate of Change (RoC) jumped the most since June 9, offering bullish signals. That said, caution is warranted amidst mixed signals between oscillators.
If XAG/USD extends its gains past the 200-day EMA, it could open the door for further upside. Key resistance levels lie at $23.00 per troy ounce, followed by the June 15 low of $23.22, before testing the 20-day EMA at $23.32. A breach of the latter will expose the 100-day EMA at $23.23.
Conversely, the most likely scenario for XAG/USD is the near term; the first support would be a May 26 low of $22.68. Once cleared, XAG/USD could dive to June’s 23 low at $22.11 before challenging the $22.00 psychological level.
XAG/USD Price Action – Daily chart
