NZD/USD clears daily gains following US data
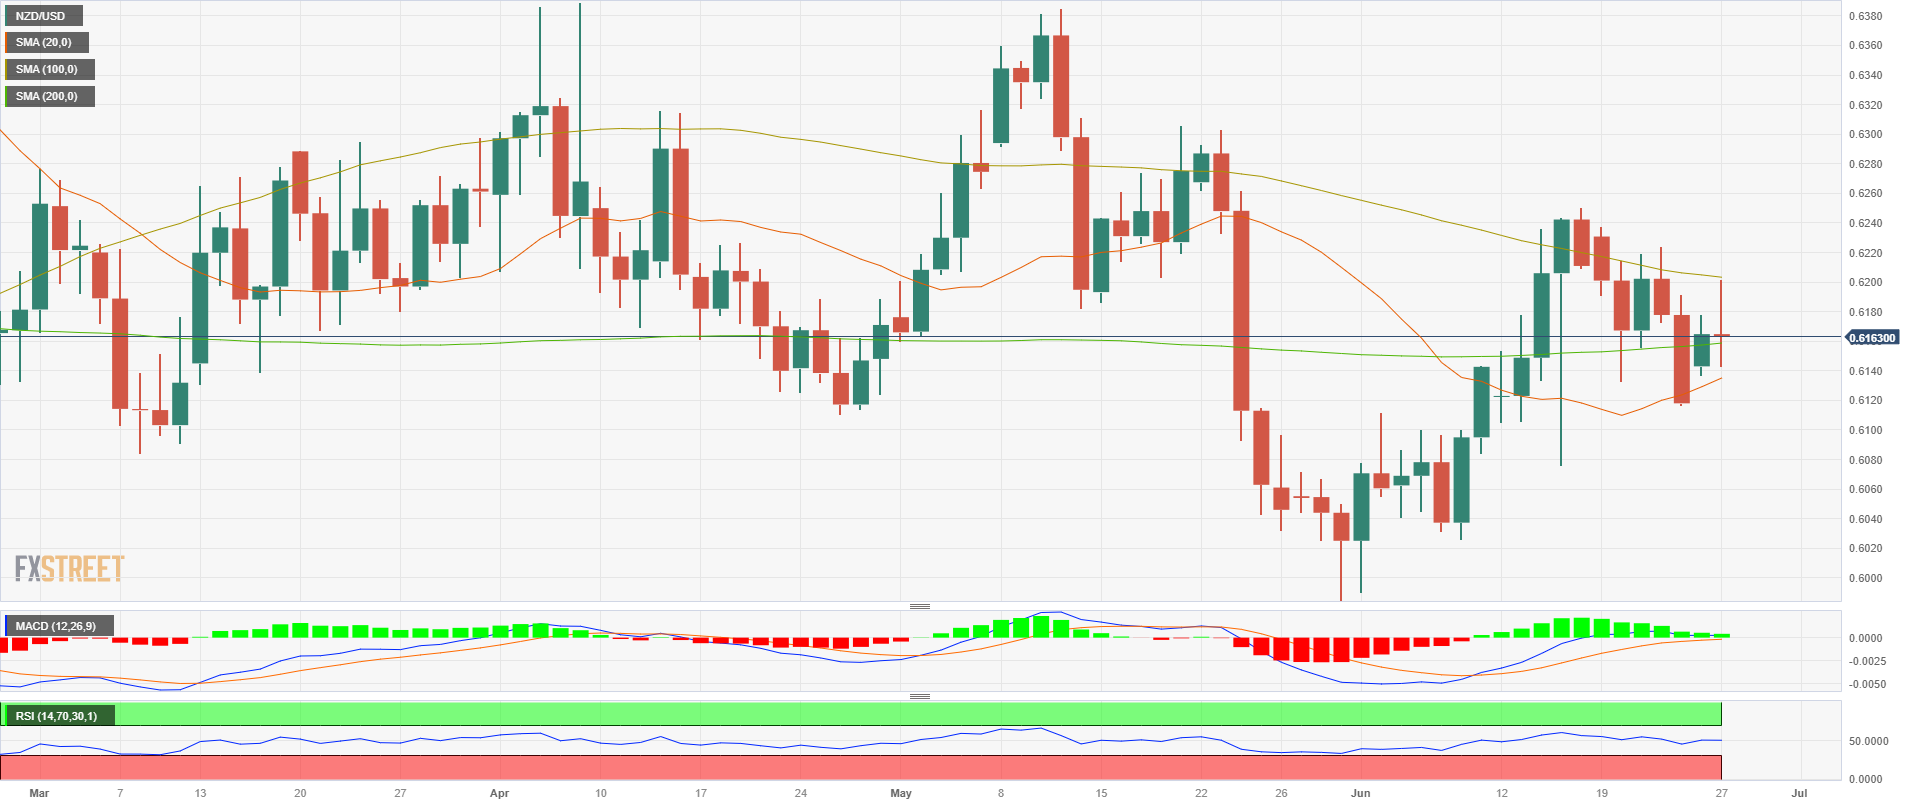
- On Tuesday, the NZD/USD traded in the 0.6200 - 0.6155 range and consolidated itself above the 100-day SMA.
- Durable Goods and Housing Market data showed optimistic results.
- The Greenback gained some traction from hawkish bets on the Fed.
In Tuesday's trading session, the NZD/USD experienced fluctuations within a range of 0.6200 to 0.6155, ultimately settling above the 100-day Simple Moving Average (SMA) at 0.6170. The market witnessed positive outcomes from Durable Goods and Housing Market data, while the Greenback strengthened as expectations of a more hawkish stance from the Federal Reserve increased.
Positive US data helped the DXY clear some losses
In May, the Durable Goods Orders in the US showed a notable improvement, rising by 1.7% compared to the previous month's 1.2% increase, exceeding the market consensus of -1%. Additionally, the New Home Sales for May experienced a substantial surge, surpassing expectations of a 0.5% change. This robust performance highlights the resilience of the housing market.
As a reaction, as robust economic data may allow the Federal Reserve (Fed) to continue hiking, US bond yields recovered on the day. The 2-year yield rose to 4.76% while the 5 and 10-year to 4.03% and 4.76%. That being said, the bond market could see further volatility on Wednesday, when investors will look for clues regarding the Fed’s next steps.
On the Kiwi’s side, investors will watch Retail Sales data, released at the early Asian session on Thursday, to get a clearer outlook of New Zealand’s economic outlook.
NZD/USD levels to watch
According to the daily chart, despite indicators turning somewhat flat, they still favour the NZD. In that sense, the Relative Strength (RSI) and Moving Average Convergence Divergence (MACD) hold in positive territory while the pair trades above the 200 and 20-day Simple Moving Averages (SMA).
On the upside, immediate resistance stands at the 100-day SMA, near the daily highs at 0.6200, followed by 0.6230 and 0.6250. On the downside, the 200 and 20-day SMAs act as the nearest support levels, at 0.6160 and 0.6135.
NZD/USD Daily chart
