WTI gains momentum amid output cuts and fears of global economic slowdown; eyes set on $84.00
- US crude oil benchmark, WTI, rises for the third consecutive day, trading at $83.48, up by 0.80%.
- Oil demand is predicted to grow by 2.25 million bpd in 2024, down from 2024’s 2.44 million bpd, according to OPEC+.
- Weakness in China’s economy could dent oil demand.
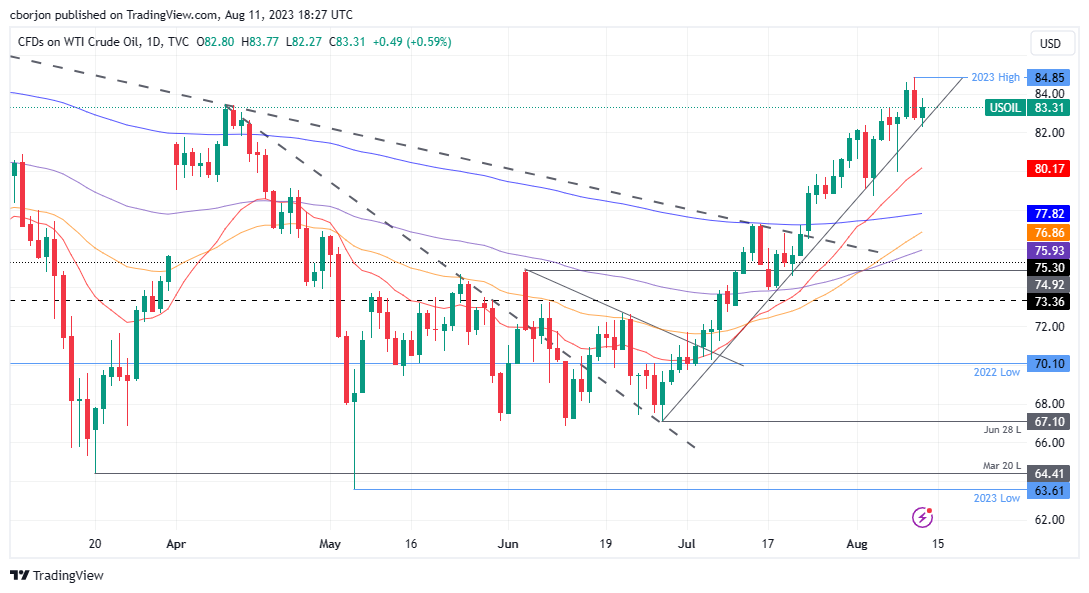
Western Texas Intermediate (WTI), the US crude oil benchmark advances for the third day in the week, trims some of its Thursday’s losses, as it tracks an upslope support trendline since mid-July. At the time of writing, WTI is exchanging hands at $83.48, above its opening price by 0.80%.
OPEC+ output reductions and weakening US dollar support crude’s upward trajectory, despite potential demand concerns from China
Oil prices rose on several factors weighing on the market, like Saudi Arabia and Russia’s 1.3 million of crude oil output cuts, while the International Energy Agency (IEA) stated supply cuts by the Organization of Petroleum Exporting Countries and its allies (OPEC+), could drive prices higher before economic headwinds dent global demand growth.
In the meantime, OPEC+ noted that Oil’s demand would increase by 2.25 million bpd in 2024, below this year’s 2.44 million bpd.
Meanwhile, the United States (US) inflation figures on the consumer side witnessed a dip, which weakened the greenback, and underpinned WTI’s towards its new year-to-date (YTD) high above $84.00 per barrel. Nevertheless, Friday’s US PPI data bolstered the US Dollar (USD) as shown by the US Dollar Index (DXY), gaining 0.24% at 102.870, while WTI’s prices drifted lower.
Mixed economic data from China would keep WII’s gains capped on fears the country has been hit by deflation, suggesting the Covid-19 recovery would remain losing steam, weighing on oil demand,
WTI Price Analysis: Technical outlook

WTI’s daily chart portrays the pair as upward biased, thought at the brisk of a support trendline break, which could see WTI’s diving towards the 20-day Exponential Moving Average (EMA) at $80.18, followed by the $80.00 figure. On the upside, WTI’s first supply zone to test would be the $84.00, ahead of challenging the $85.00 a barrel.