Gold Price Forecast: Strong US Dollar, yields direct XAU/USD bears toward $1,890, China/US data eyed
- Gold Price remains subdued at the lowest level in five weeks amid firmer US Dollar, Treasury bond yields.
- Risk-off mood, mostly upbeat US data underpins bearish bias about XAU/USD.
- China’s Country Garden, Zhongrong Trust renew debt fallout woes and weigh on sentiment, firmer yields flag recession fears.
- China/US Retail Sales, manufacturing data will direct intraday Gold Price moves but Fed Minutes are key for clear guide.
Gold Price (XAU/USD) fades the late Monday’s corrective bounce off the 200-DMA support by retreating to $1,907 during the early hours of Tuesday’s Asian session, depressed at the five-week low flashed the previous day by the press time. In doing so, the XAU/USD bears the burden of the US Dollar’s strength amid economic fears surrounding China. Also exerting downside pressure on the Gold Price could be the cautious mood ahead of the US Retail Sales for July. It’s worth noting that the US Dollar ignores the looming fears of the Federal Reserve’s (Fed) policy pivot in September, as well as recently softer United States inflation clues while tracing firmer US Treasury bond yields.
Gold Price remains bearish as yields, China underpin US Dollar strength
Gold Price remains depressed amid the firmer US Dollar and fears surrounding the biggest XAU/USD customer China. In doing so, the bright metal fails to justify its traditional haven status, as well as marks inability to cheer concerns that the US Federal Reserve (Fed) will hold rates steady in its September monetary policy meeting, backed by the recently softer US data.
The looming debt crisis in China and its contagion impact, especially amid the fears that economic recovery in the world’s biggest industrial player fades, weighs on the Gold Price even if the easing inflation concerns allow market players to remain hopeful. Also challenging the market sentiment and the XAU/USD could be Russia’s firing of warning shots at a warship in the Black Sea and readiness to equip new nuclear submarines with hypersonic missiles.
It’s worth noting that a suspension of its bond trading by China’s Country Garden joins the non-receipt of the payments from a subsidiary of Chinese conglomerate Zhongzhi Enterprise Group to bolster the debt woes and weighed on sentiment on Monday.
Recently, US Treasury Secretary Janet Yellen crossed wires, via Reuters, late Monday while citing the risks to the global economic developments from China’s slowdown, the Russia-Ukraine war and climate change-related disasters and their spillover effects.
Talking about the US data, the New York one-year inflation expectations eased to 3.5% for July, down three points, while also suggesting confidence in positive labor market conditions and economic transition.
Amid these plays, US Dollar Index (DXY) rose to its highest level since July 07 before retreating from 103.46, around 103.16 by the press time. That said, the US 10-year Treasury bond yields rose to the highest level in nine months whereas the two-year counterpart also refreshed the monthly peak amid the market’s dumping of the Treasury bonds. It should be observed that such higher yields previously triggered recession woes and the risk-off sentiment which in turn favored the US Dollar due to its haven appeal and drowned the Gold Price.
US/China Retail Sales, risk catalysts eyed for clear XAU/USD moves
Looking ahead, China’s Industrial Production and Retail Sales for July will be closely observed amid fears of losing economic momentum in the world’s second-biggest economy. Following that, the US Retail Sales for the said month will be more important as market players keep betting on the Fed’s policy pivot in September, which in turn may weigh on the US Dollar and trigger the Gold Price recovery should the scheduled data weakens.
Gold Price Technical Analysis
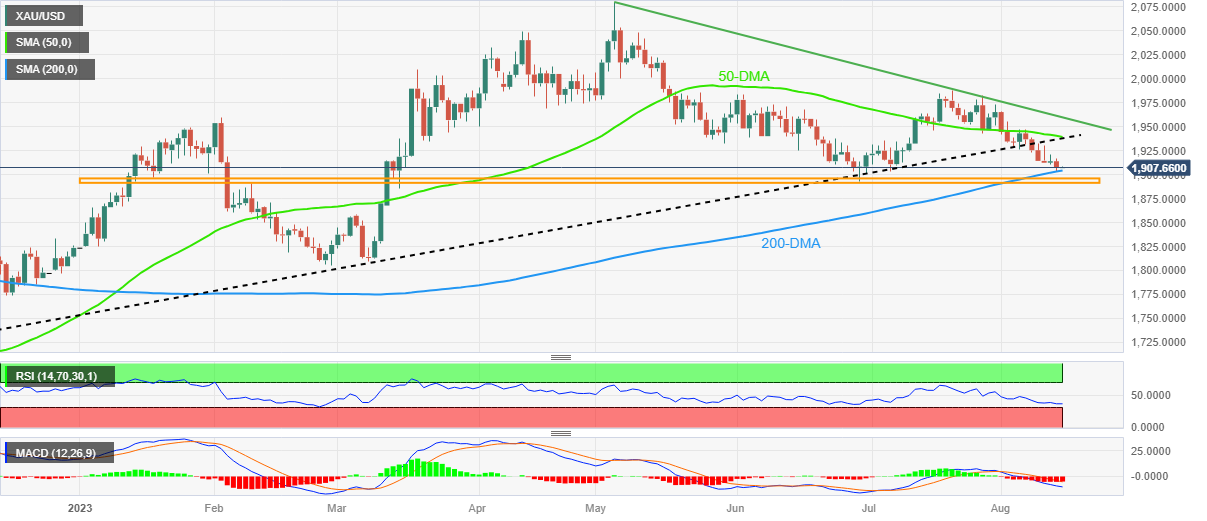
Gold Price justifies the downside break of an ascending trend line from November 2022 as it prods the 200-DMA support. Also favoring the XAU/USD sellers are the bearish signals from the Moving Average Convergence and Divergence (MACD) indicator.
It’s worth noting, however, that the Relative Strength Index (RSI) line, placed at 14, stays beneath the 50.0 level and suggests bottom-picking of the Gold Price.
The same highlights the 200-DMA support of around $1,905, as well as a seven-month-old horizontal support zone of around $1,890.
In a case where the XAU/USD drops below the $1,890 support, the odds of witnessing a slump toward an early March swing high of around $1,858 can’t be ruled out.
On the contrary, a convergence of the previous support line and the 50-DMA, around $1,940 by the press time, appears a tough nut to crack for the Gold buyers.
Following that, a downward-sloping resistance line from early May, close to $1,960 at the latest, will act as the last defense of the XAU/USD bears.
Overall, the Gold Price is likely to remain bearish but the downside room appears limited.
Gold Price: Daily chart

Trend: Limited downside expected