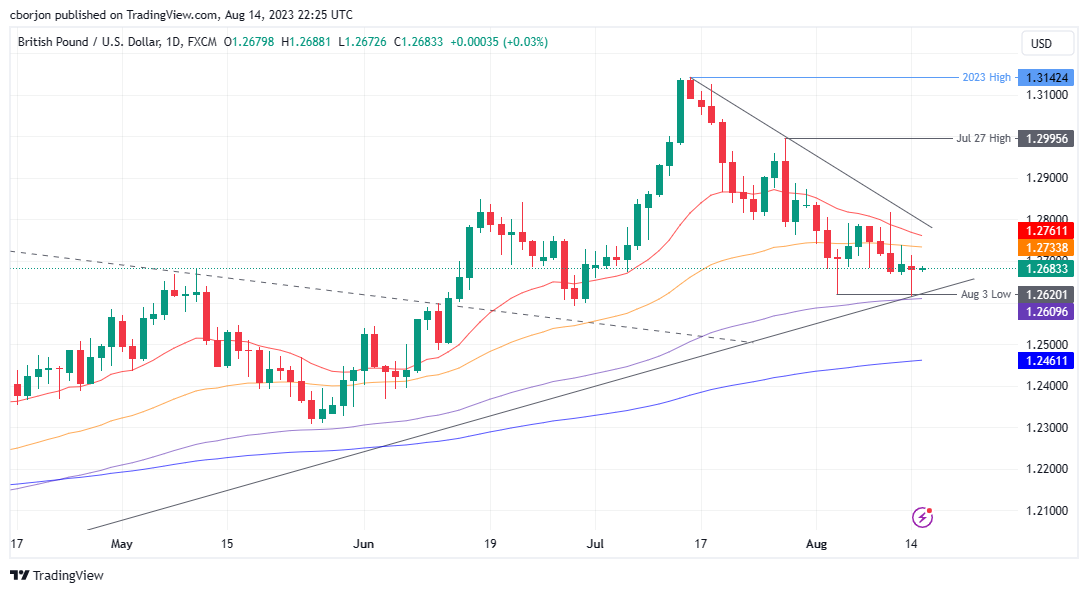
GBP/USD Price Analysis: Rebound at two-week lows, as double-bottom suggests potential gains
- GBP/USD edges north amid slight optimism in the Asian session.
- A double bottom chart pattern could pave the way for the GBP/USD towards 1.3000.
- Immediate resistance is seen at the 50-day and 20-day EMAs. Breaking these could propel the pair toward the August 10 and July 27 highs. However, a breach below the 100-day EMA could shift momentum toward the 200-day EMA.
GBP/USD aims upward for minimal gains of 0.02% as the Asian session begins, but still printing weekly losses following Monday’s session in which the GBP/USD lost 0.10% and reached a two-week low. At the time of writing, the GBP/USD exchanges hands at 1.2682.
GBP/USD Price Analysis: Technical outlook
From a technical perspective, the GBP/USD is neutral-upward biased, as the major dived towards the 100-day Exponential Moving Average (EMA) at 1.2609. Still, buyers entered the market, lifting the spot price to current levels. Notably, the GBP/USD is forming a ‘double bottom’ chart pattern that could pave the way for further gains, but first, the GBP/USD must reclaim resistance technical levels to confirm its validity.
The GBP/USD first resistance would be the 50-day EMA at 1.2733, followed by the 20-day EMA at 1.2761. Once those levels are surpassed, the GBP/USD next stop would be the August 10 high of 1.2819. If buyers push prices above those levels, the July 27 daily high at 1.2995 would be up for grabs.
On the other hand, if GBP/USD tumbled past the 100-day EMA at 1.2609, it would clear the way to challenge 1.2600 and the 200-day EMA at 1.2461.
GBP/USD Price Action – Daily chart
