Silver Price Analysis: XAG/USD bears need validation from $22.10 and FOMC Minutes
- Silver Price retreats towards seven-week-old horizontal support amid cautious mood.
- Economic fears emanating from China, firmer US Dollar weigh on XAG/USD price.
- RSI conditions, multi-day-long horizontal region prod Silver sellers.
- Bear cross, sustained trading below the key resistance line and SMAs challenge XAG/USD recovery hope.
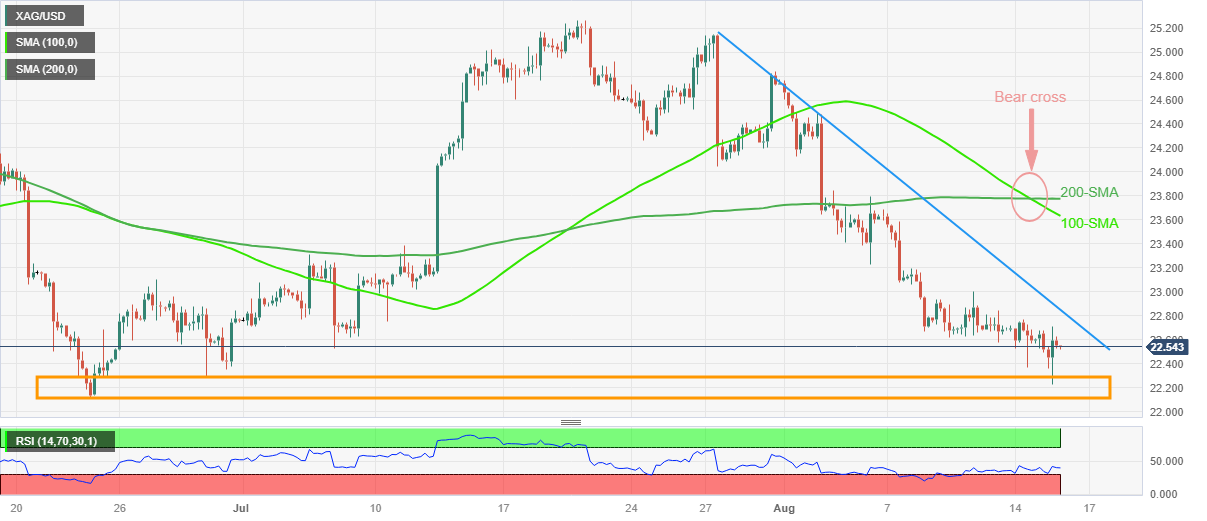
Silver Price (XAG/USD) remains pressured at the lowest level in seven weeks despite making rounds to $22.50 during the early Asian session on Wednesday. In doing so, the bright metal fades the previous day’s corrective bounce off the key support zone amid the market’s broad risk-off mood and the firmer US Dollar and the Federal Reserve (Fed) monetary policy meeting minutes.
It’s worth noting that China-inflicted market pessimism joins the firmer US data to underpin the US Dollar’s run-up and weigh on the XAG/USD ahead of this week’s top-tier catalyst.
Technically, the 100-SMA stays beneath the 200-SMA and portrays the “Bear Cross”, which in turn suggests further downside of the Silver Price. Also keeping the XAG/USD sellers hopeful is the commodity’s sustained trading below a three-week-long descending resistance line.
However, a horizontal area comprising multiple levels marked since June 23, close to $22.10–30, puts a floor under the XAG/USD price amid a nearly oversold RSI (14) line.
In a case where the Silver Price breaks the $22.10 support, it becomes vulnerable to testing the early March swing high of around $21.30 with the $22.00 threshold likely acting as an intermediate halt.
On the flip side, a clear break of the immediate resistance line, close to $22.85 at the latest, will direct the XAG/USD toward the 100-SMA hurdle of around $23.65. Though, the 200-SMA level of near $23.80 acts as the final defense of the Silver sellers.
Silver Price: Four-hour chart

Trend: Limited downside expected