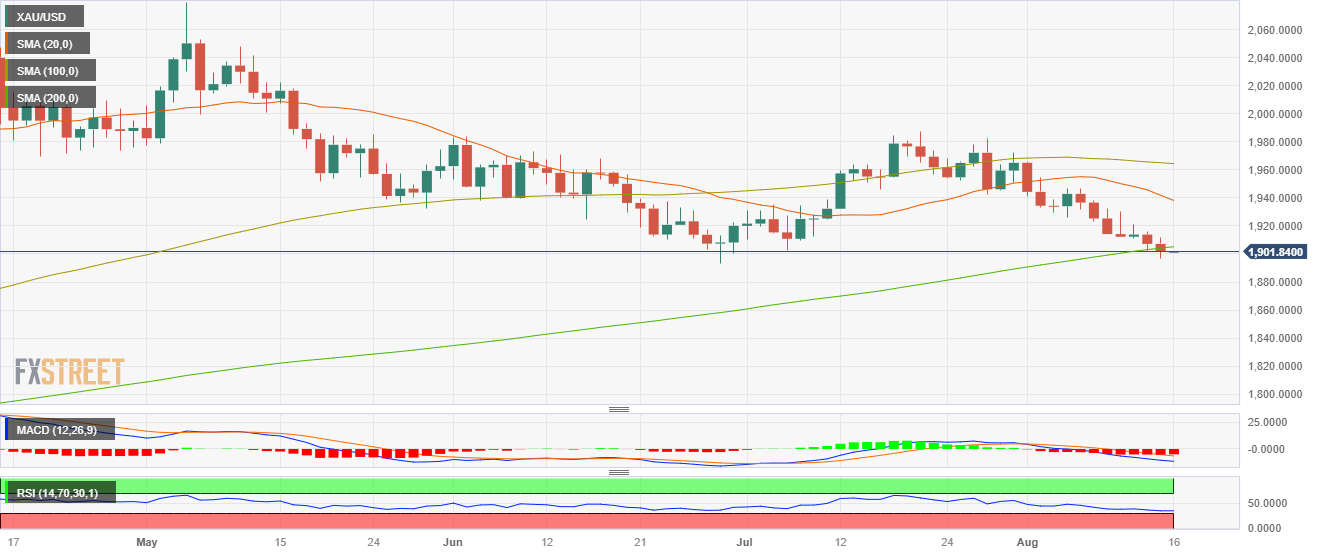
Gold Price Forecast: XAU/USD falls below the 200-day SMA ahead of FOMC minutes
- XAU/USD fell near the $1,900 zone, below the 200-day SMA.
- Economic figures from the US point out that the Fed may still have room to hike.
- Investors await Wednesday’s FOMC minutes to look for further clues.
In Tuesday’s session, the XAU/USD faced selling pressure, lost the 200-day Simple Moving Average, and fell to $1,900 an ounce. In that sense, bearish pressure can be attributed to markets gearing up for another Federal Reserve (Fed), not in September but in November. The latest data revealed that the headline and core Consumer Price Index (CPI) decelerated in July, but the Producer Price Index (PPI) accelerated. In addition, July’s Retail Sales from the US were reported to have increased higher than expected.
As for now, according to the CME FedWatch tool, markets discount low odds of a hike in the upcoming September meeting, but the odds of a hike in November rise nearly 40%. In that sense, the July meeting's Federal Open Market Committee (FOMC) minutes will help investors model their expectations.
XAU/USD Levels to watch
The daily chart analysis indicated that the XAU/USD has a bearish technical bias for the short term, with Relative Strength Index (RSI) and Moving Average Convergence Divergence (MACD) residing in negative territory. The RSI also exhibits a southward slope below its midline, emphasising the presence of intense selling pressure, while the MACD, with its red bars, highlights the strengthening bearish momentum for the XAU/USD. Furthermore, the pair is below the 20,100 and 200-day Simple Moving Averages (SMAs), indicating that the sellers dominate the broader perspective.
Support levels: $1,890, $1,870, $1,850
Resistance levels: $1,905 (200-day SMA), $1,930, $1,950.
XAU/USD Daily chart
