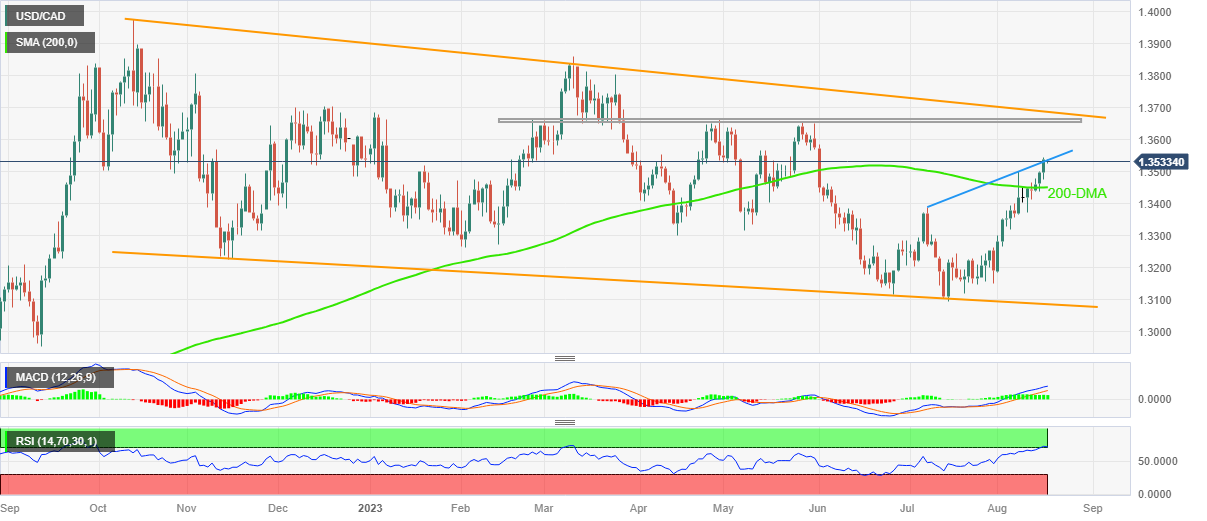
USD/CAD Price Analysis: Pokes six-week-old resistance above 1.3500 amid overbought RSI
- USD/CAD grinds at the highest level in 11 weeks as bulls take a breather after three-day uptrend.
- Overbought RSI (14) line, 1.5-month-long rising trend line prod buyers but 200-DMA puts a floor under Loonie prices.
- Horizontal resistance area from late February, 10-month-old falling resistance line add to upside filters.
USD/CAD seesaws around the highest level since early June, marked the previous day, as bulls jostle with the key upside hurdle amid overbought RSI conditions. Even so, the Loonie pair defends the early-week breakout of the 200-DMA while flirting with the 1.3530-35 amid Thursday’s Asian session, after a three-day uptrend.
That said, an upward-sloping resistance line from July 07 restricts the immediate USD/CAD upside near 1.3540 as the overbought RSI and the lack of major data/events check the Loonie pair buyers.
However, a sustained upside break of the 200-DMA and the bullion MACD signals keep the buyers hopeful unless the quote drops below 1.3450 DMA support.
Even if the quote breaks the stated 1.3450 support, the early July swing high of around 1.3385 and late 2022 bottom surrounding 1.3325 may prod the USD/CAD bears.
It’s worth mentioning that a nine-month-old falling support line, close to 1.3085 at the latest, will challenge the quote’s weakness past 1.3325.
On the flip side, a daily closing beyond the immediate 1.3450 hurdle could quickly direct the USD/CAD buyers toward a horizontal area comprising multiple levels marked since late February around 1.3655–65.
Following that, a descending resistance line from October 2022, around 1.3690 by the press time, will challenge the Loonie pair buyers.
USD/CAD: Daily chart

Trend: Pullback expected