Gold Price Forecast: XAU/USD pares Fed inflicted losses at five-month low under $1,900 as yields struggle
- Gold Price recovers from the lowest level in five months but lack follow-through.
- US Dollar cheers hawkish Federal Reserve Minutes before the yields prod buyers, underpinning corrective bounce of XAU/USD.
- China woes join Fitch Ratings’ downward revision of growth forecasts for 10 developed economies to prod Gold buyers.
- Fed concerns, China headlines and mid-tier US data eyed for fresh impulse about XAU/USD.
Gold Price (XAU/USD) prods a three-day losing streak while posting a corrective bounce from the lowest level since mid-March. In doing so, the XAU/USD cheers the latest inaction of the US Treasury bond yields, as well as the US Dollar, to recover from $1,891 to $1,894 amid the early hours of Thursday’s Asian session. That said, the Federal Reserve (Fed) Minutes underpinned a run-up in the Greenback that drowned the bullion prices to the multi-day low a few hours back. It’s worth noting, however, that the technical and fundamentals both flag doubts about the latest Gold Price recovery amid a lack of major supportive catalysts, except for the recently lackluster US Treasury bond yields.
Gold Price rebound amid market consolidation
Gold Price prints the first daily gains, so far, in four as it bounces off the five-month low. It’s worth noting that the XAU/USD’s latest corrective bounce could best be considered a consolidation amid an absence of major data/events that could have supported the move. On the contrary, many negatives from the US Federal Reserve, United States data and China prod the Gold buyers, not to forget the fears of the slowing growth in top-tier economies.
Among the key negatives, the Monetary Policy Meeting Minutes of the Federal Open Market Committee’s (FOMC) July 25-26 meeting recently drowned the Gold Price by highlighting the discussion on the inflation pressure, despite marking a division on the rate hike. That said, the Minutes also conveyed that most policymakers preferred supporting the battle again the ‘sticky’ inflation.
Elsewhere, mostly firmer United States data also underpinned the XAU/USD’s fall to the previous day. That said, the US Industrial Production marked a surprise 1.0% growth for July versus 0.3% expected and -0.8% prior while the Capacity Utilization for the said month also improved to 79.3% from 78.6%, compared to market forecasts of 79.1%. Further, the Building Permits edged higher to 1.442M for July from 1.441M whereas the Housing Starts rose to 1.452M for the said month versus 1.398M prior and 1.448M expected. It’s worth noting that both the Building Permits Change and Housing Starts Change improved more than market forecasts and previous readings. Previously, the US Retail Sales grew 0.7% MoM in July versus 0.4% expected and 0.3% reported in June (revised from 0.2%) and suggested strong consumer spending, mainly due to improved wages, which in turn favored the US Dollar to stay firmer amid early weekdays.
Furthermore, the growing fears from China, one of the biggest Gold customers, join the chatters about the softer growth in developed economies, backed by the global rating agency Fitch Ratings, weigh on the sentiment. The same defends the US Dollar bulls and challenges the XAU/USD rebound.
It’s worth noting that the recent downbeat closing of Wall Street and the firmer US Treasury bond yields, despite the latest retreat from the yearly high by the 10-year benchmark, question the Gold buyers.
China, Fed concerns eyed for XAU/USD directions
Given the light calendar ahead, Gold traders should pay attention to headlines surrounding China’s economic growth, as well as the Fed talks, for clear directions. Also important will be the US weekly jobless claims and Philadelphia Fed Manufacturing Survey for August.
Also read: Gold Price Forecast: XAU/USD pierces $1,900 ahead of FOMC Minutes
Gold Price Technical Analysis
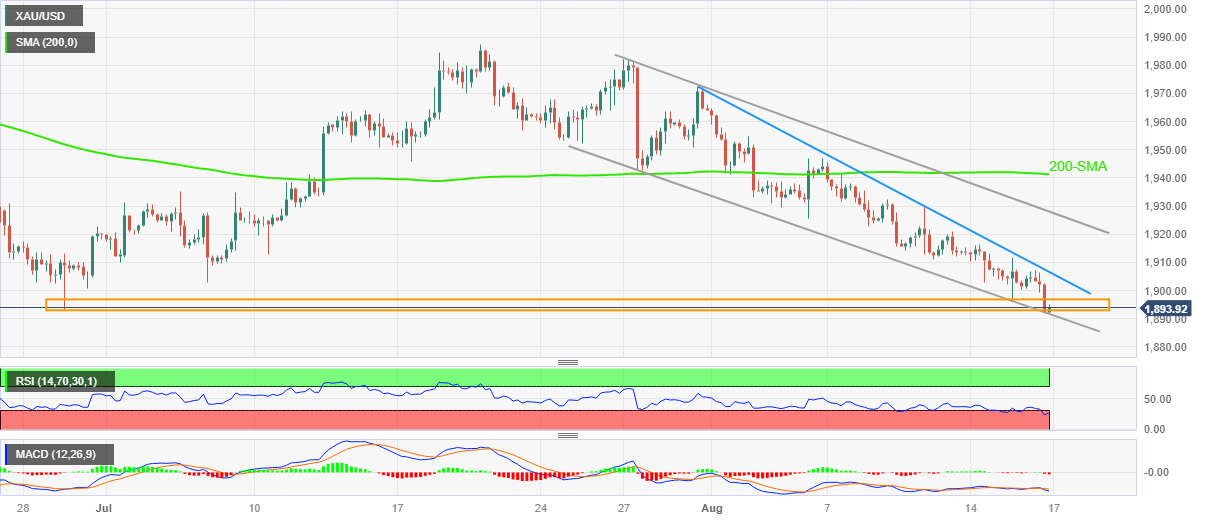
Gold Price stays on the bear’s radar despite the latest corrective bounce from the bottom line of a three-week-long descending trend channel.
It’s worth noting that the nearly oversold conditions of the Relative Strength Index (RSI) line, placed at 14, underpins the XAU/USD’s bottom-picking as the Moving Average Convergence and Divergence (MACD) indicator signals the trader’s indecision.
With this, a slight recovery in the Gold Price toward a downward-sloping resistance line from July 31, close to $1,906, can’t be ruled out. However, the XAU/USD buyers remain off the table unless witnessing a clear upside break of the stated channel’s top line, close to $1,930 by the press time.
Even so, the 200-SMA hurdle surrounding $1,942 acts as the final defense of the Gold bears.
Meanwhile, a horizontal area comprising the lows marked since late June near the $1,896-93 zone, as well as the stated channel’s bottom line near $1,890, puts a floor under the Gold Price.
In a case where the XAU/USD remains bearish past $1,890, the odds of witnessing a slump toward an early March swing high of around $1,858 can’t be ruled out.
Gold Price: Four-hour chart

Trend: Limited recovery expected