GBP/USD Price Analysis: Multiple upside hurdles past 1.2700, firmer US Dollar prod Cable buyers
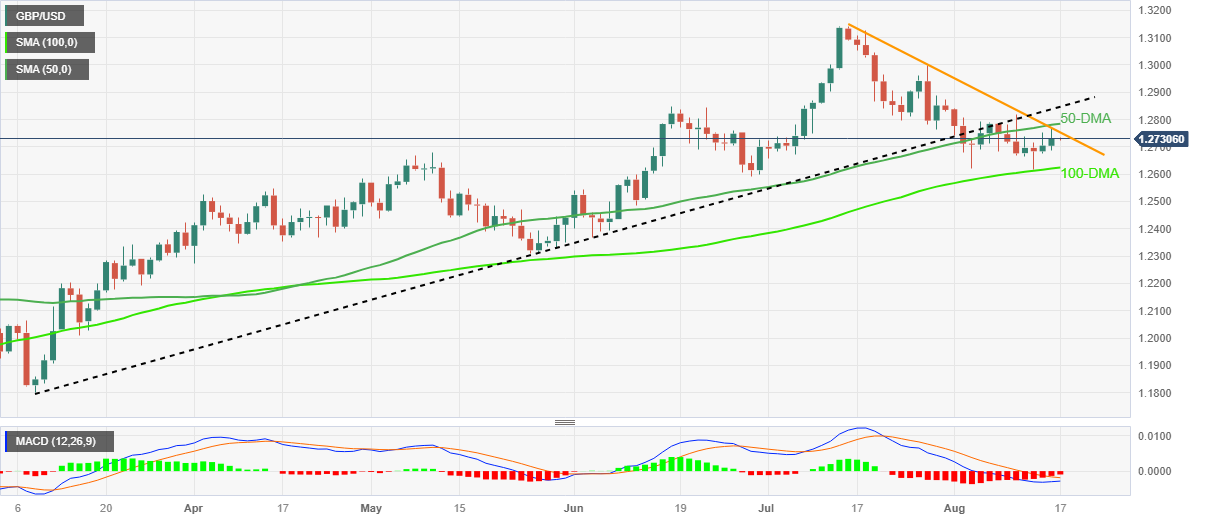
- GBP/USD defends rebound from 100-DMA at weekly top, prods one-month-old falling resistance line.
- 50-DMA, multi-day-old previous support line add to the upside filters.
- Looming bull cross on MACD adds strength to recovery hopes but US Dollar’s strength tests Cable buyers.
- Late June’s low will challenge Pound Sterling sellers past 100-DMA.
GBP/USD edges higher past 1.2700 as it flirts with the weekly top surrounding 1.2730 amid the early hours of Thursday’s Asian session. In doing so, the Cable pair defends Monday’s U-turn from the 100-DMA while approaching a downward-sloping resistance line from July 14 after a three-day winning streak.
Not only a rebound from the 100-DMA but the impending bull cross on the MACD also underpins the upside bias about the Pound Sterling.
However, a clear break of the stated resistance line, close to 1.2750 by the press time, isn’t an open invitation to the Cable buyers as the 50-DMA hurdle of around 1.2785 prods the short-term advances of the quote.
Following that, a 5.5-month-old previous support line, now resistance around 1.2850, acts as the final defense of the GBP/USD bears.
Meanwhile, the broadly firmer US Dollar, backed by the upbeat Fed Minutes and yields of late, challenge the Pound Sterling buyers and tease a pullback toward the 100-DMA retest, especially amid a light calendar on Thursday. That said, the 100-DMA level is around 1.2625 by the press time.
In a case where the GBP/USD pair remains bearish past 1.2625, the weekly bottom of 1.2616 and the late June trough surrounding 1.2590 will test the sellers before giving them control.
GBP/USD: Daily chart

Trend: Limited upside expected