Silver Price Analysis: XAG/USD continues dips below $22.50 as US yields rise
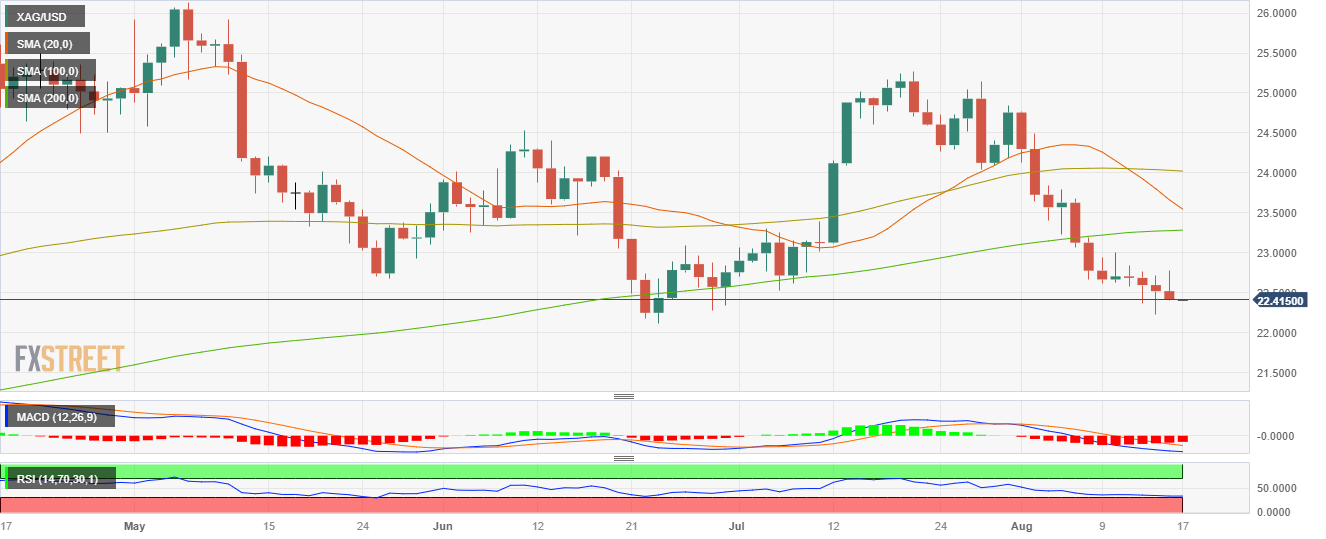
- XAG/USD is about to approach oversold conditions, trading below the $22.50 area.
- The USD strengthened after the released of hawkish FOMC Minutes from the July meeting.
- Increasing US yields fuel the USD´s upward momentum.
In Wednesday's session, the silver spot price XAG/USD continued losing traction and traded below the $22.50 zone, showing around 0.50% losses on the day. The US dollar, measured by the DXY index, is gaining ground, driven by the July Federal Open Market Committee (FOMC) minutes from July's meeting, which revealed that the members are open to potential interest rate hikes, exerting downward pressure on the grey metal.
The recent FOMC minutes from July revealed that many participants were worried about inflation pressures due to a strong US economy. This led some members to consider raising interest rates again if the incoming data contributes to inflationary pressures. As a result, the market participants bet on a hawkish Federal Reserve (Fed), and the US treasury yields for 2,5 and 10-year, which could be seen as the opportunity cost of holding non-yielding metals, are trading with gains at 4.98%, 4.42% and 4.25%, respectively.
XAG/USD Levels to watch
The short-term view for XAG/USD suggests a bearish outlook based on the daily chart analysis. Both Relative Strength Index (RSI) and Moving Average Convergence Divergence (MACD) remain in negative territory, with Relative Strength Index (RSI) positioned below its midline and displaying a southward slope. Moving Average Convergence Divergence (MACD) also exhibits red bars, signalling bearish momentum. Furthermore, the pair is below the 20,100,200-day SMAs, indicating that the sellers command the broader perspective.
Support levels: $22.30,$22.15,$22.00.
Resistance levels: $22.50, $22.80, $23.00.
XAG/USD Daily chart
