GBP/USD Price Analysis: Bulls attack 1.2760 hurdle with eyes on UK Retail Sales
- GBP/USD remains sidelined around short-term key resistance confluence after posting three-day winning streak.
- Cable trader’s preparations for UK Retail Sales for July allowed Pound Sterling to remain sidelined.
- Upbeat oscillators, sustained trading beyond seven-week-old rising support line favors pair buyers.
- Convergence of 100-SMA, five-week-old falling resistance line challenge recovery moves ahead of the key UK data.
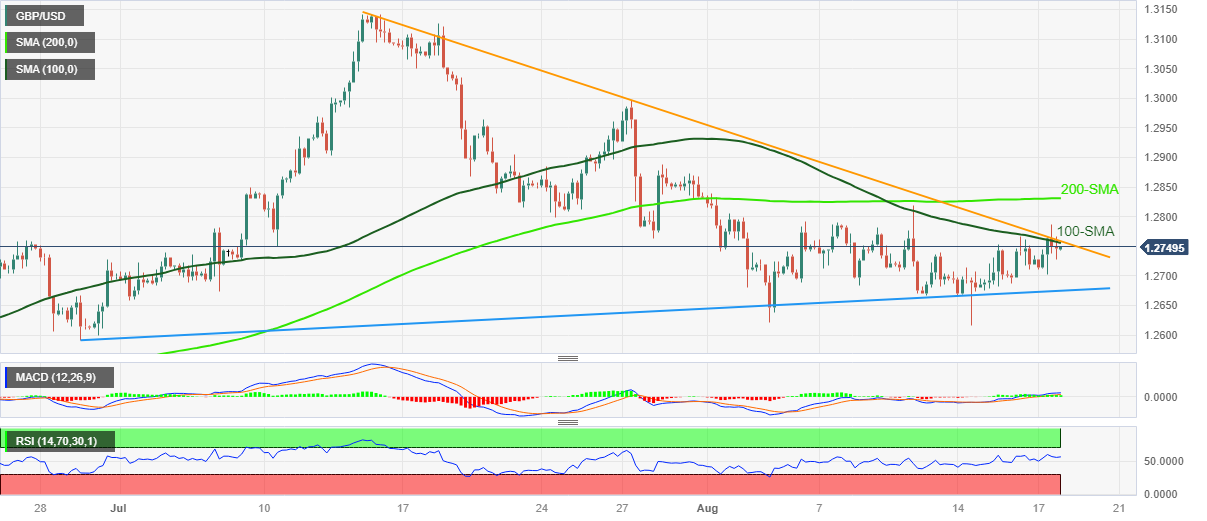
GBP/USD jostles with a short-term key resistance while making rounds to 1.2760 amid the early Asian session on Friday. In doing so, the Cable pair prods the three-day winning streak ahead of the UK Retail Sales for July.
That said, the Cable pair’s successful trading above a seven-week-old rising support line, around 1.2675 by the press time, joins the bullish MACD signals and gradually rising the RSI (14) line to keep the GBP/USD buyers hopeful.
However, a downward-sloping resistance line from July 14 and the 100-SMA together constitute the 1.275-60 zone as a tough nut to crack for the Cable pair buyers.
Following that, the 1.2800 and the 200-SMA level of around 1.2830 will act as the last defense of the GBP/USD bears.
It’s worth noting that the downbeat expectations from the UK Retail Sales, expected -0.5% MoM in July versus 0.7% expected, can join the risk-off mood to prod the Cable buyers.
On the other hand, a daily closing below the multi-day-old support line surrounding 1.2675 becomes necessary for the GBP/USD bears to retake control.
Even so, multiple supports around 1.2600 may test the Pound Sterling bears before giving control to them.
GBP/USD: Four-hour chart

Trend: Limited recovery expected