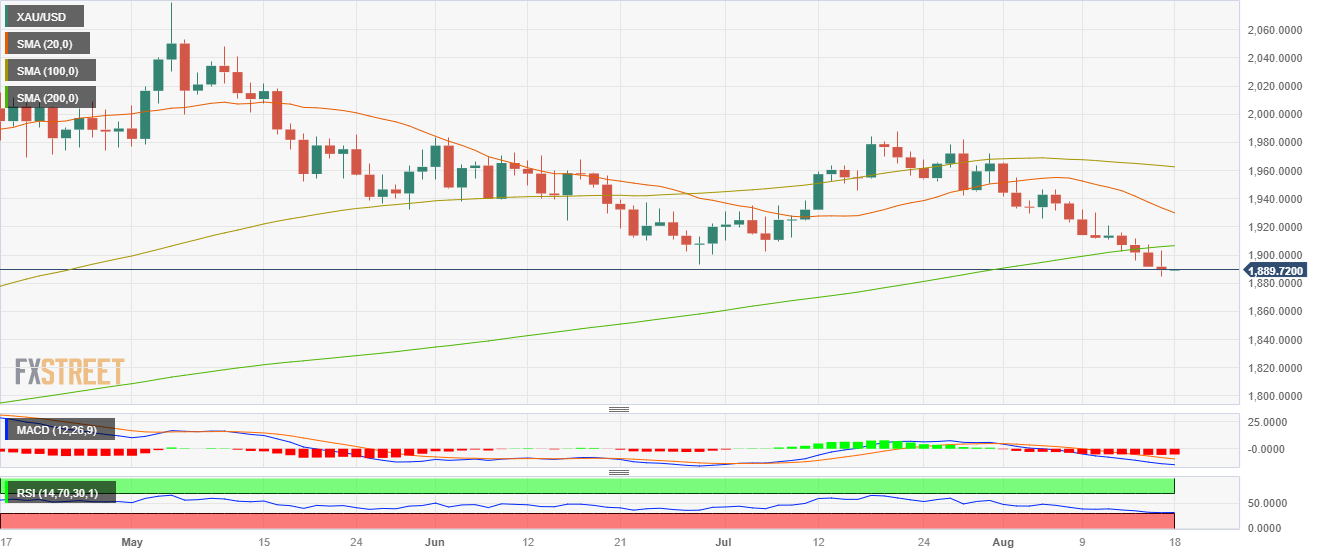
Gold Price Forecast: XAU/USD closes below the 200-day SMA beneath $1,900
- XAU/USD dropped towards the $1,890 area, its lowest since March 13.
- A stronger USD and higher US yields are responsible for the metal’s downward trajectory.
On Thursday, the XAU/USD gold spot price traded below $1,900 and faced renewed selling pressure amid stronger USD and higher US treasury bond yields.
In line with that, on Wednesday, the Federal Open Market Committee (FOMC) minutes revealed that members were open to continuing hiking due to upside risks related to inflation, pointing out that the labour market remains extremely tight, which boosts hawkish bets on the Federal Reserve (Fed).
In that sense, the 10-year yield, which could be seen as the opportunity cost of holding gold, rose to a multi-month high of 4.28%, while the 2 and 5-year bond rates rose more than 1% to 4.93% and 4.41%. This rise may be attributed to the odds of a hike, as per the CME FedWatch tool, in November of the Fed of 25 basis points, rising near 40%.
XAU/USD Levels to watch
Analysing the daily chart, XAU/USD presents a bearish outlook for the short term. Both Relative Strength Index (RSI) and Moving Average Convergence Divergence (MACD) remain in negative territory, with the RSI positioned below its midline and showcasing a southward slope. The MACD also displays red bars, further supporting the intensifying bearish momentum. Furthermore, the pair is below the 20,100 and 200-day Simple Moving Averages (SMAs), suggesting that the bears are firmly in control of the bigger picture.
Support levels: $1,870, $1,850, $1,830
Resistance levels: $1,900, $1,906 (200-day SMA), $1,930.
XAU/USD Daily chart
