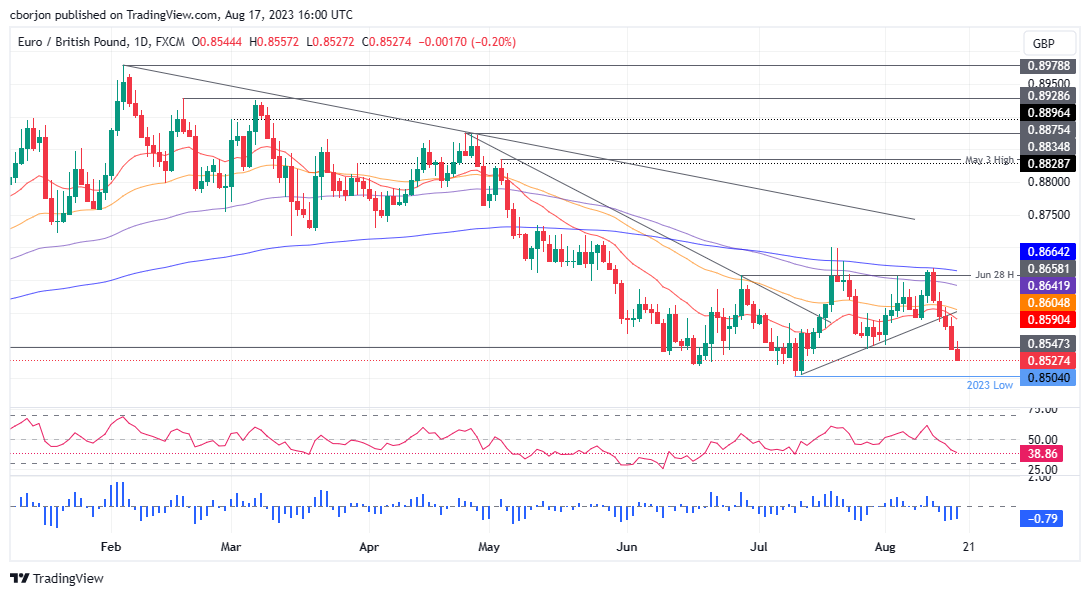
EUR/GBP Price Analysis: Extends its downtrend amid GBP strength, YTD low eyed
- Sterling gains strength as UK inflation data, although showing signs of easing, remains high, suggesting further action by the BoE.
- Technical analysis indicates a bearish tilt for EUR/GBP after breaking past the July 27 daily low of 0.8544.
- Immediate support lies at the YTD low of 0.8504. A breach of this level could see the pair target the August 14, 2022, low of 0.8408.
- On the upside, resistance is found at the August 15 high of 0.8593
The EUR/GBP prolongs its losses to five consecutive trading days as sellers eye a challenge of the year-to-date (YTD) low of 0.8504, sponsored by overall Sterling (GBP) strength. Although UK’s inflation figures show signs of easing, is still high, warranting further tightening by the Bank of England (BoE). Therefore, the GBP remains strong, as witnessed by the EUR/GBP trading at 0.8530, down 0.17%.
EUR/GBP Price Analysis: Technical Outlook
The EUR/GBP daily chart portrays the pair as subdued but slightly tilted bearish after breaking previous support, cracking the July 27 daily low of 0.8544, opening the door for a deeper correction. Up next, the EUR/GBP would test the YTD low of 0.8504, which once cleared, and it would expose the 2022 August 14 low of 0.8408.
Conversely, if EUR/GBP stays above 0.8500, the next resistance would emerge at the August 15 high of 0.8593. if buyers push prices above that level, next would be the 0.8600 figure, followed by the 50 and 100-day Exponential Moving Averages (EMAs) at 0.8605 and 0.8640.
EUR/GBP Price Action – Daily chart
