New Zealand’s Gross Domestic Product contracts 0.9% QoQ in Q2 vs. -0.3% expected
New Zealand's Gross Domestic Product (GDP) declined by 0.9% QoQ in the second quarter (Q2), compared with a 0.9% expansion (revised from 0.8%) in the first quarter, Statistics New Zealand showed on Thursday. This reading came in weaker than contraction of 0.3%.
The second-quarter GDP contracted by 0.6% YoY, compared with a fall of 0.6% (revised from -0.7%) in Q1, while missing the estimation of 0%.
Market reaction to New Zealand’s GDP data
The New Zealand Dollar (NZD) attracts some sellers in an immediate reaction to the downbeat New Zealand’s GDP report. The NZD/USD pair is trading at 0.5942, losing 0.34% on the day.
New Zealand Dollar Price Last 7 Days
The table below shows the percentage change of New Zealand Dollar (NZD) against listed major currencies last 7 days. New Zealand Dollar was the weakest against the Australian Dollar.
| USD | EUR | GBP | JPY | CAD | AUD | NZD | CHF | |
|---|---|---|---|---|---|---|---|---|
| USD | -0.90% | -0.72% | -0.29% | -0.51% | -0.88% | -0.23% | -1.12% | |
| EUR | 0.90% | 0.19% | 0.54% | 0.39% | -0.02% | 0.66% | -0.21% | |
| GBP | 0.72% | -0.19% | 0.42% | 0.22% | -0.21% | 0.48% | -0.36% | |
| JPY | 0.29% | -0.54% | -0.42% | -0.13% | -0.65% | 0.05% | -0.52% | |
| CAD | 0.51% | -0.39% | -0.22% | 0.13% | -0.42% | 0.26% | -0.57% | |
| AUD | 0.88% | 0.02% | 0.21% | 0.65% | 0.42% | 0.70% | -0.16% | |
| NZD | 0.23% | -0.66% | -0.48% | -0.05% | -0.26% | -0.70% | -0.69% | |
| CHF | 1.12% | 0.21% | 0.36% | 0.52% | 0.57% | 0.16% | 0.69% |
The heat map shows percentage changes of major currencies against each other. The base currency is picked from the left column, while the quote currency is picked from the top row. For example, if you pick the New Zealand Dollar from the left column and move along the horizontal line to the US Dollar, the percentage change displayed in the box will represent NZD (base)/USD (quote).
This section was published on Wednesday at 20:38 GMT as a preview of New Zealand’s Gross Domestic Product data.
NZ GDP Overview
The latest quarterly Gross Domestic Product (GDP) growth figures from New Zealand are expected just ahead of the Thursday market rollover, at 22:45 GMT on Wednesday.
NZ GDP has struggled to impress markets recently, and the second quarter of 2025 is not expected to deliver much different. QoQ growth is expected to contract by 0.3%, while annualized growth is seen at a flat 0.0%, barely clawing back from a -0.7% contraction in the first quarter.
How could it impact NZD/USD?
It will take a significant swing in either direction to push the Kiwi into a fresh momentum swing. Markets are spent on volatility after the Federal Reserve (Fed) cautiously trimmed interest rates for the first time in almost ten months, and there are little surprises on offer from middling Antipodean growth metrics.
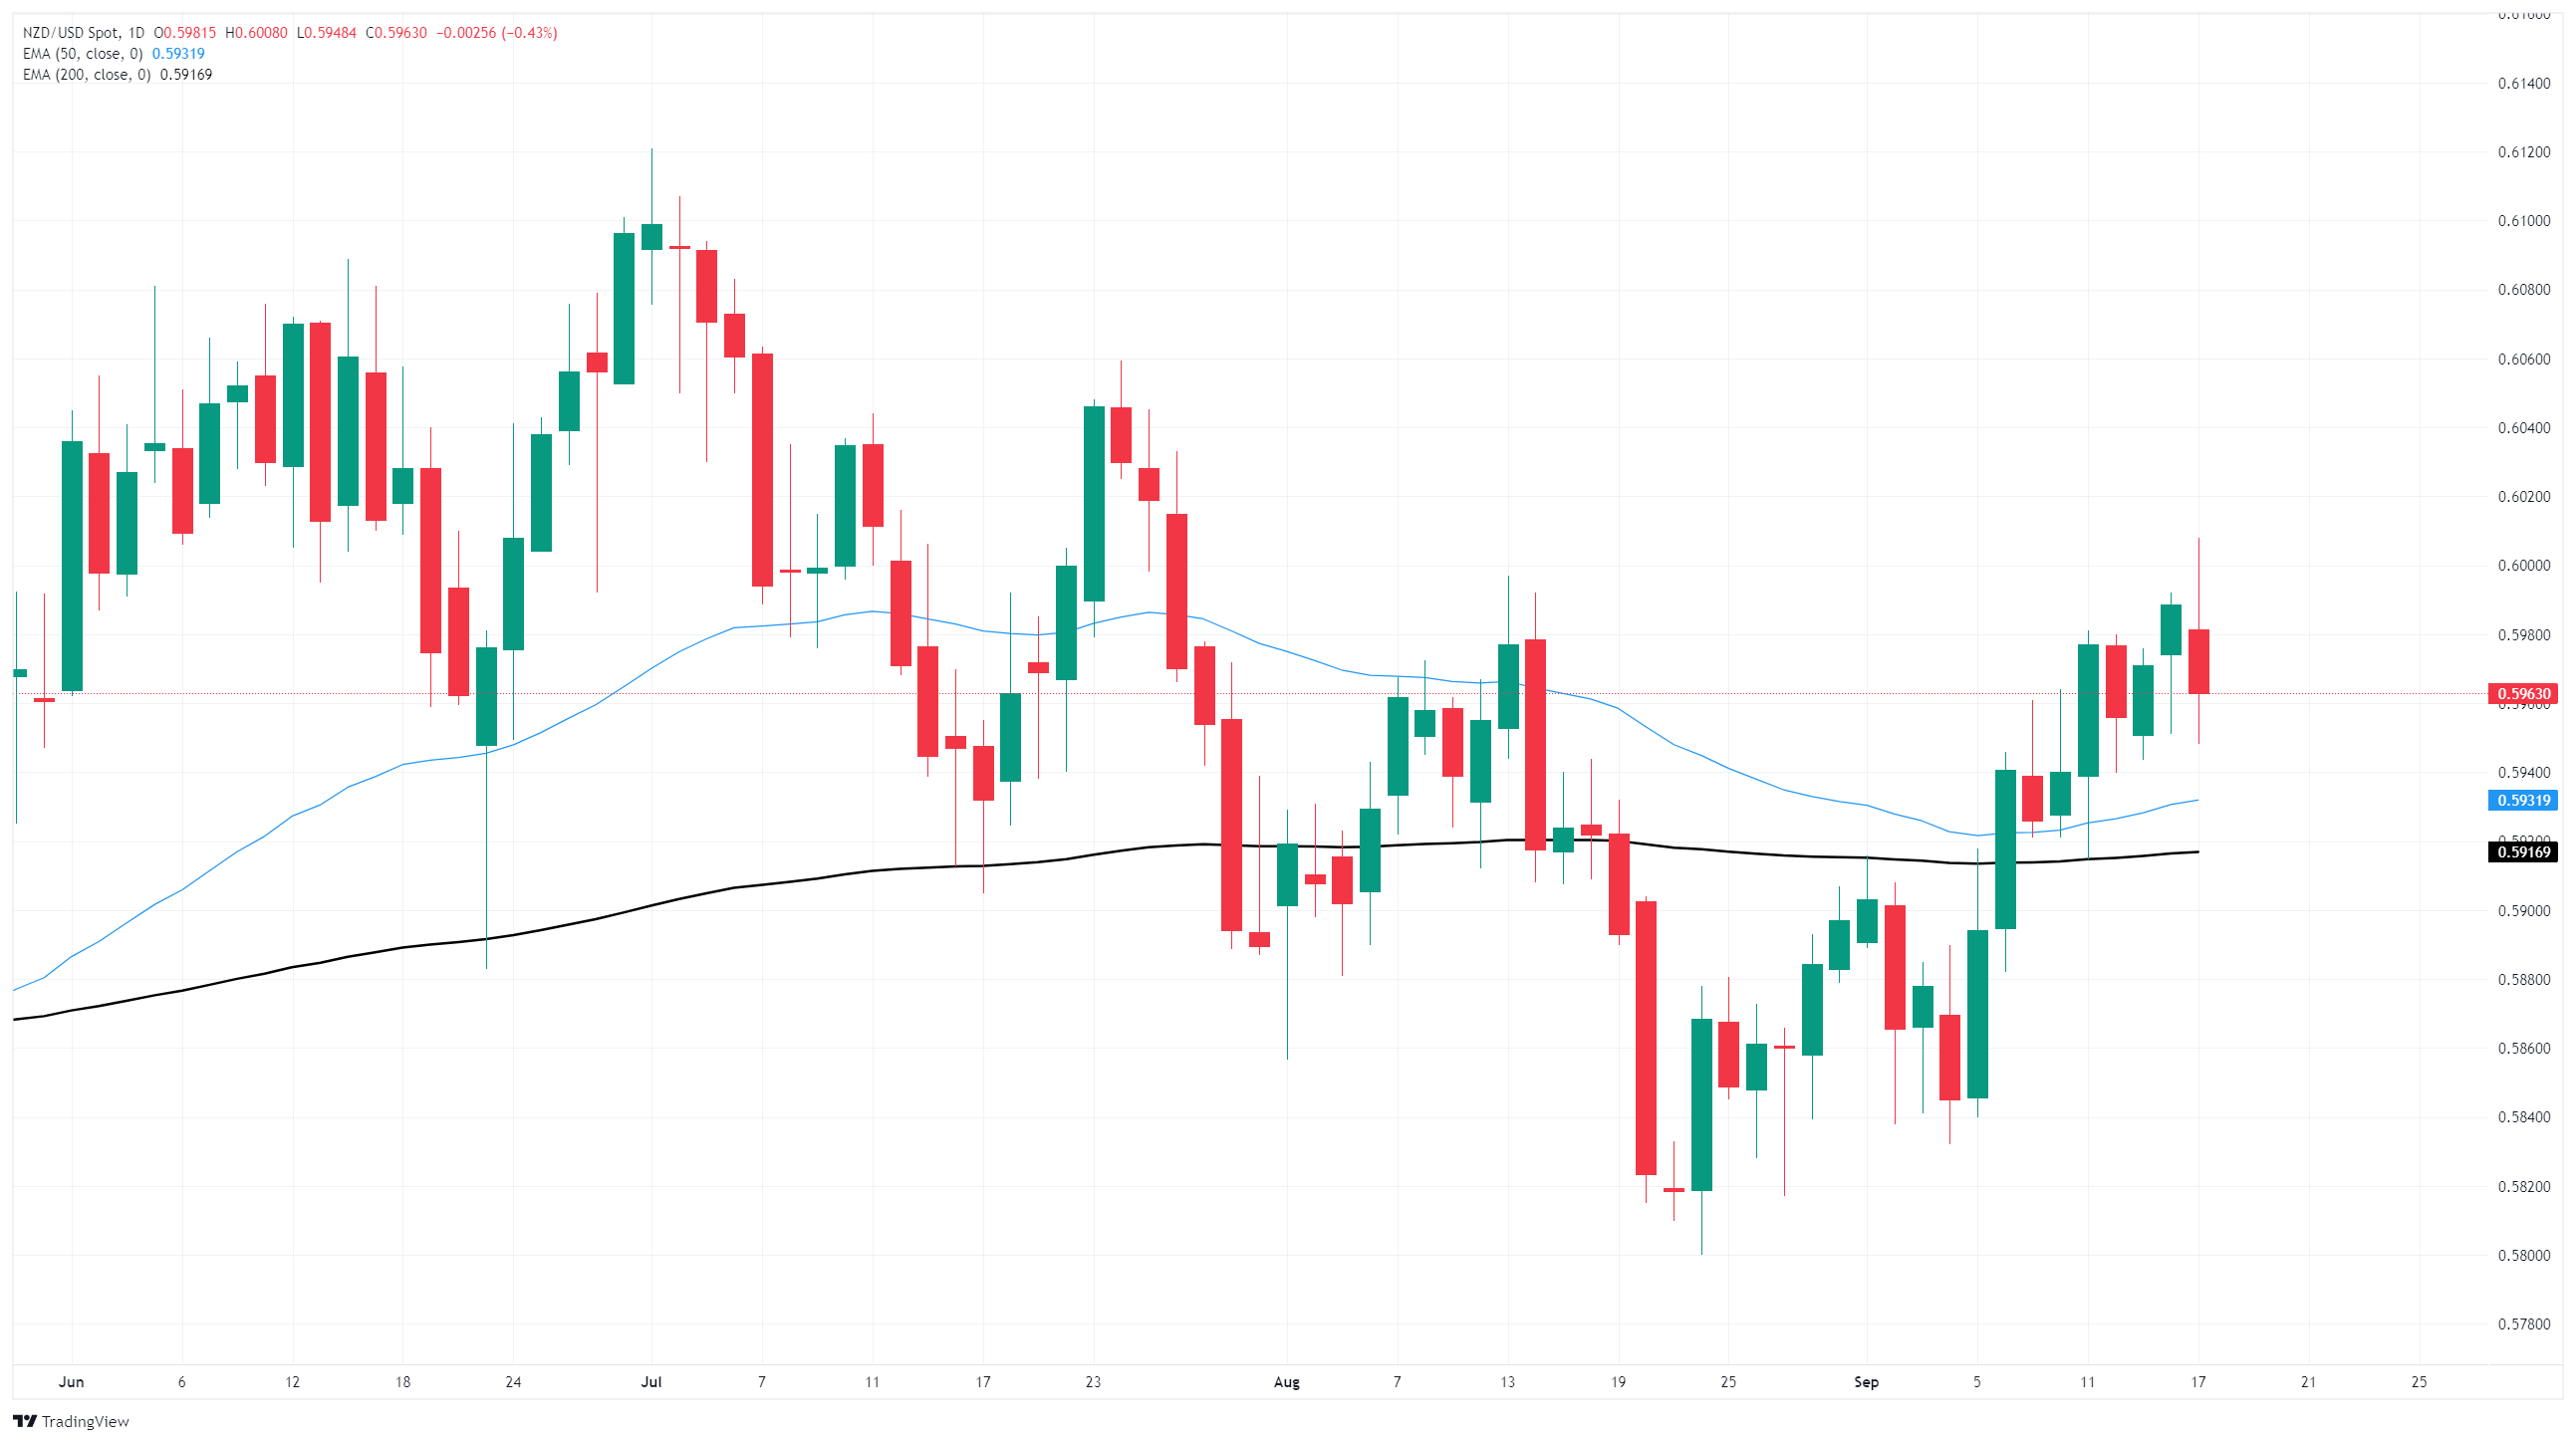
NZD/USD broke out of a messy descending channel on daily candlesticks, but the 0.6000 level remains a tricky barrier for price action to vault over, and bullish momentum is likely to remain capped as bids wrestle to stay above the 200-day Exponential Moving Average (EMA) near 0.5933.
NZD/USD daily chart
Economic Indicator
Gross Domestic Product (QoQ)
The Gross Domestic Product (GDP), released by Statistics New Zealand on a quarterly basis, is a measure of the total value of all goods and services produced in New Zealand during a given period. The GDP is considered as the main measure of New Zealand’s economic activity. The QoQ reading compares economic activity in the reference quarter to the previous quarter. Generally, a high reading is seen as bullish for the New Zealand Dollar (NZD), while a low reading is seen as bearish.
Read more.Next release: Wed Sep 17, 2025 22:45
Frequency: Quarterly
Consensus: -0.3%
Previous: 0.8%
Source: Stats NZ
The Gross Domestic Product (GDP), released by Statistics New Zealand, highlights the overall economic performance on a quarterly basis. The gauge has a significant influence on the Reserve Bank of New Zealand’s (RBNZ) monetary policy decision, in turn affecting the New Zealand dollar. A rise in the GDP rate signifies improvement in the economic conditions, which calls for tighter monetary policy, while a drop suggests deterioration in the activity. An above-forecast GDP reading is seen as NZD bullish.
GDP FAQs
A country’s Gross Domestic Product (GDP) measures the rate of growth of its economy over a given period of time, usually a quarter. The most reliable figures are those that compare GDP to the previous quarter e.g Q2 of 2023 vs Q1 of 2023, or to the same period in the previous year, e.g Q2 of 2023 vs Q2 of 2022. Annualized quarterly GDP figures extrapolate the growth rate of the quarter as if it were constant for the rest of the year. These can be misleading, however, if temporary shocks impact growth in one quarter but are unlikely to last all year – such as happened in the first quarter of 2020 at the outbreak of the covid pandemic, when growth plummeted.
A higher GDP result is generally positive for a nation’s currency as it reflects a growing economy, which is more likely to produce goods and services that can be exported, as well as attracting higher foreign investment. By the same token, when GDP falls it is usually negative for the currency. When an economy grows people tend to spend more, which leads to inflation. The country’s central bank then has to put up interest rates to combat the inflation with the side effect of attracting more capital inflows from global investors, thus helping the local currency appreciate.
When an economy grows and GDP is rising, people tend to spend more which leads to inflation. The country’s central bank then has to put up interest rates to combat the inflation. Higher interest rates are negative for Gold because they increase the opportunity-cost of holding Gold versus placing the money in a cash deposit account. Therefore, a higher GDP growth rate is usually a bearish factor for Gold price.