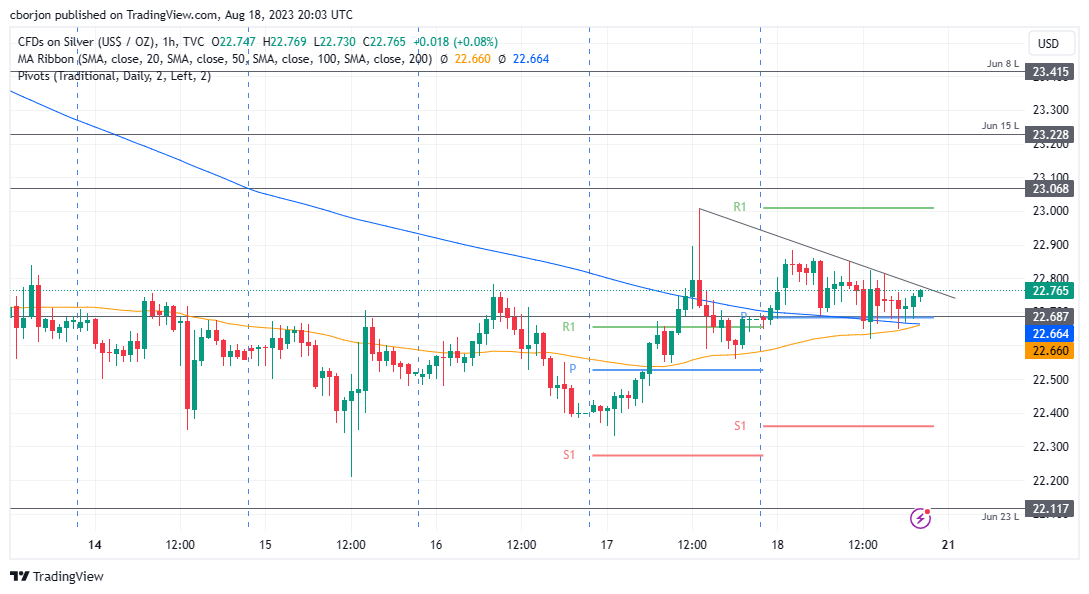
Silver Price Analysis: XAG/USD glimmers amid falling US bond yields, hovers around $22.70s
- Silver price edges up 0.07% on Friday, buoyed by a dip in US Treasury bond yields and a mixed market sentiment.
- Technicals suggest XAG/USD’s struggle near the weekly highs of $23.00, with the 200-day DMA acting as a key barrier.
- Immediate resistance lies at the downslope trendline, with potential targets at $22.80 and pivotal $23.00 per ounce.
Silver price recovers some bright towards the end of the week, climbing 0.07% on Friday, underpinned by US Treasury bond yields falling, while the Greenback trims its weekly gains. Mixed sentiment surrounding the financial markets was another reason for the non-yielding metal to climb in the session, The XAG/USD is trading at $22.74 after hitting a daily low of $22.64.
XAG/USD Price Analysis: Technical outlook
Although XAG/USD would finish the week with gains, price action offered sellers a better entry price on Thursday, particularly for traders entering nearby the weekly highs of $23.00. Buyers’ failure to extend its gains, and reclaim the 200-day Moving Average (DMA) at $23.29, keeps the white metal exposed to selling pressure.
From an intraday perspective, the XAG/USD remains trading sideways, slightly tilted upwards, with upside risks remaining, as XAG/USD is testing a downslope resistance trendline. A breach of the latter will expose the $22.80 price level, followed by the confluence of the weekly high and Friday’s R1 daily pivot at around $23.00 per ounce.
A decisive break would expose the June 15 daily low turned resistance at $23.22, ahead of testing the June 8 low at $23.42.
XAG/USD Price Action – Hourly chart
