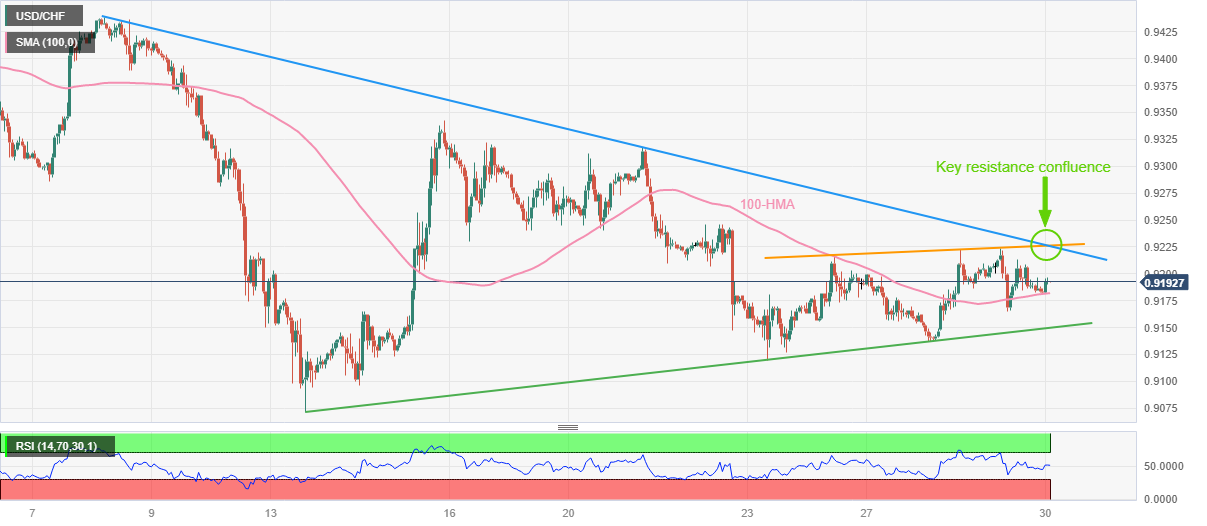
USD/CHF Price Analysis: Extends bounce off 100-HMA towards 0.9230 key hurdle
- USD/CHF picks up bids to reverse the previous day’s pullback from weekly high.
- Convergence of one-week-old resistance line, descending trend line from early March prods Swiss Franc pair buyers.
- Bears need validation from 13-day-old ascending support line to retake control.
USD/CHF bulls are back to the table, following the previous day’s retreat, as the quote grinds higher around 0.9200 during early Thursday. In doing so, the Swiss currency pair bounces off the 100-Hour Moving Average (HMA) while also justifying the upward-sloping RSI (14) line, not overbought.
As a result, the USD/CHF buyers are likely to witness more gains. However, a convergence of an ascending trend line from the last Friday and a three-week-old descending resistance line, around 0.9230, appears a tough nut to crack for the pair buyers before retaking control.
In a case where the USD/CHF buyers manage to keep the reins past 0.9230, a run-up towards 0.9300 and the mid-month high surrounding 0.9340 can’t be ruled out. Though, a clear upside break of 0.9340 won’t hesitate to challenge the monthly peak of near 0.9440.
On the flip side, the 100-HMA level surrounding 0.9180 restricts the immediate downside of the USD/CHF price, a break of which could drag prices toward an ascending support line from March 13, close to 0.9150 at the latest.
It’s worth noting that the USD/CHF pair’s weakness past 0.9150 can make it vulnerable to testing the monthly low of around 0.9070.
Overall, USD/CHF is likely to rise further but the upside move needs validation from 0.9230.
USD/CHF: Hourly chart

Trend: Further upside expected