Silver Price Analysis: 50-DMA prods XAG/USD bulls around mid-$23.00s as key data/events loom
- Silver Price edges higher while refreshing two-week top, up for fifth consecutive day.
- Clear upside break of 200-DMA, firmer oscillators favor XAG/USD bulls.
- 50-DMA, late July’s swing low test Silver buyers before the key resistance line from early May.
- Bears need sustained downside break of “Golden Fibonacci Ratio” to retake control.
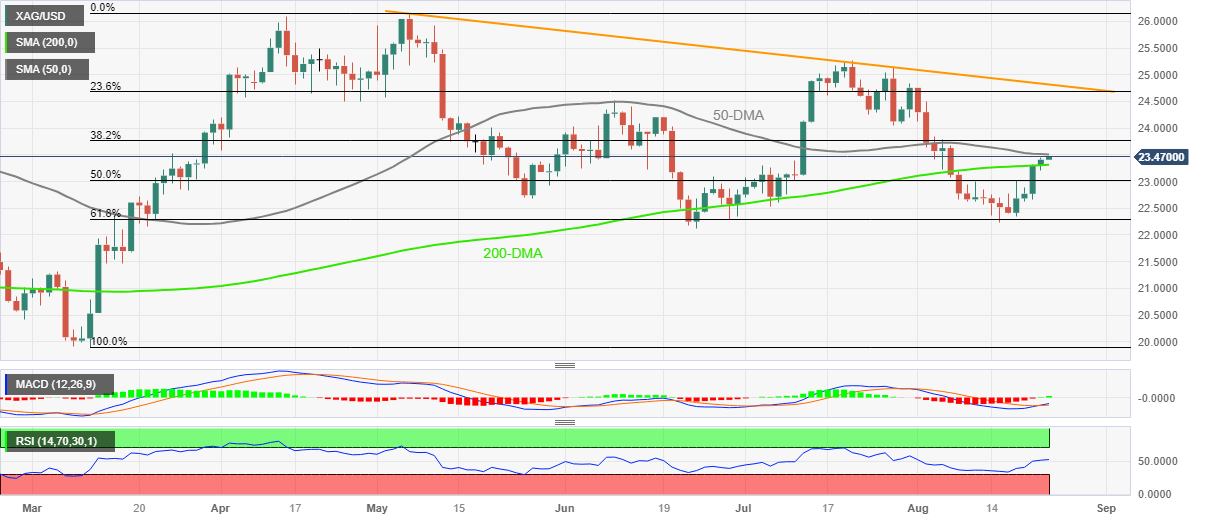
Silver Price (XAG/USD) picks up bids to refresh two-week high around $23.50 during the mid-Asian session on Wednesday.
In doing so, the XAG/USD prints five-day uptrend while justifying the previous day’s upside break of the 200-DMA, as well as the bullish MACD signals.
Also adding strength to the upside bias is the commodity’s successful recovery from the 61.8% Fibonacci retracement of the XAG/USD’s March–May upside, also known as the “Golden Fibonacci Ratio”. Furthermore, upbeat conditions of the RSI (14) line add strength to the commodity’s recovery moves.
With this, the Silver buyers are likely to overcome the immediate 50-DMA hurdle of $23.50, could direct the buyers toward the late July’s swing low surrounding $24.05.
However, a downward-sloping resistance line from May 05, close to $24.90 by the press time, appears a tough nut to crack for the Silver buyers.
Alternatively, a downside break of the 200-DMA, close to $23.30 at the latest, could convince intraday sellers of the bright metal.
Even so, the 50% and 61.8% Fibonacci retracements, respectively near $23.00 and $22.30, could challenge the Silver bears before giving them control.
Fundamentally, the market’s cautious mood ahead of today’s preliminary readings of the August month Purchasing Managers Indexes (PMIs) and the top-tier central bankers’ speeches at the annual Jackson Hole Symposium event, scheduled for August 24–26, prod the XAG/USD traders.
Also read: Forex Today: USD not ready for a correction, Global PMIs next
Silver Price: Daily chart

Trend: Further upside expected