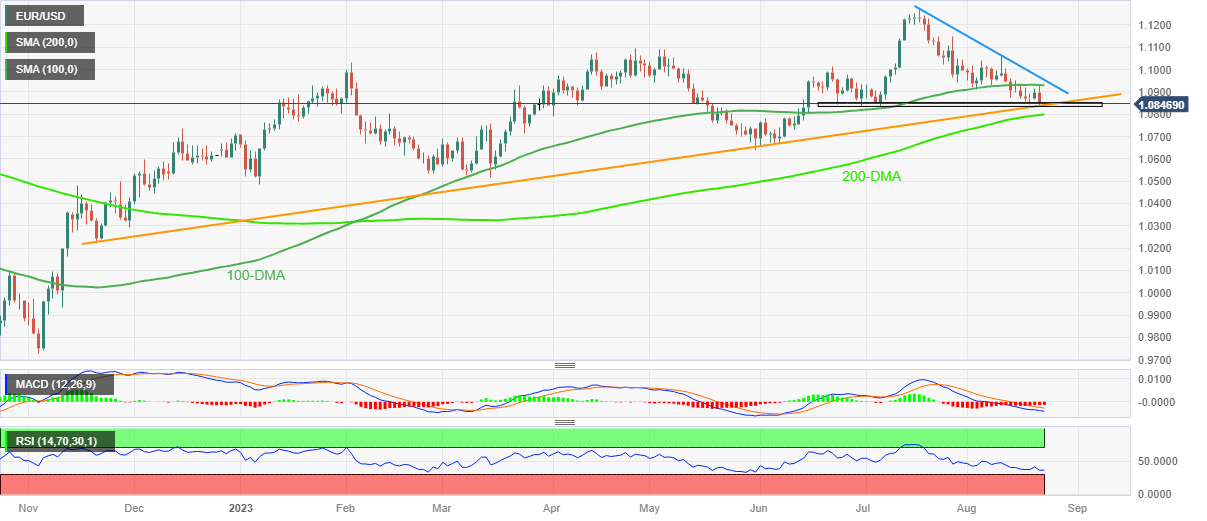
EUR/USD Price Analysis: Euro bears attack 1.0830 key support ahead of EU/US PMI
- EUR/USD remains sidelined after falling the most in a month by reversing from 100-DMA.
- One-month-old horizontal support, ascending trend line from late November and downbeat RSI restrict immediate downside of Euro.
- 200-DMA, five-week-old descending resistance line act as additional trading filters.
- Preliminary readings of August month PMIs for the Eurozone, Germany and the US will be important for fresh impetus.
EUR/USD holds lower grounds near 1.0845-50 despite portraying the pre-data inaction amid early Wednesday.
Euro dropped the most since late July while reversing from the 100-DMA the previous day. However, the cautious mood ahead of the preliminary readings of the August month Purchasing Managers Indexes (PMIs) for the Eurozone, Germany and the US restricts the major currency pair’s immediate downside.
Also read: EUR/USD hits monthly high above 1.0900, makes a U-Turn on rising US yields, ahead of Powell’s speech
Technically, a convergence of the ascending trend line from late November 2022 and a horizontal area comprising lows marked in the last two months, around 1.0835-50, restricts the immediate downside of the Euro pair. Adding strength to the stated support zone is the nearly oversold RSI (14) line, suggesting bottom-picking.
However, the 100-DMA level of 1.0930 can restrict the Euro pair’s corrective bounce, especially amid the bearish MACD signals.
Also challenging the EUR/USD buyers is a downward-sloping resistance line from July 18, close to 1.0955 by the press time.
Following that, the tops marked in February and April, respectively near 1.1035 and 1.095, will be in the spotlight.
Alternatively, a downside break of 1.0835 will need validation from the 200-DMA support of around 1.0800 to convince the EUR/USD bears in challenging May’s bottom surrounding 1.0635.
EUR/USD: Daily chart

Trend: Corrective bounce expected