EUR/GBP Price Analysis: Probed YTD lows of 0.8500, with bears eyeing 0.8400
- EUR/GBP trades between 0.8500 and 0.8550 for the fifth day, briefly touching a YTD low of 0.8504.
- Sellers eye the 0.8500 level for further downside, with next support at last year’s August 22 low of 0.8408.
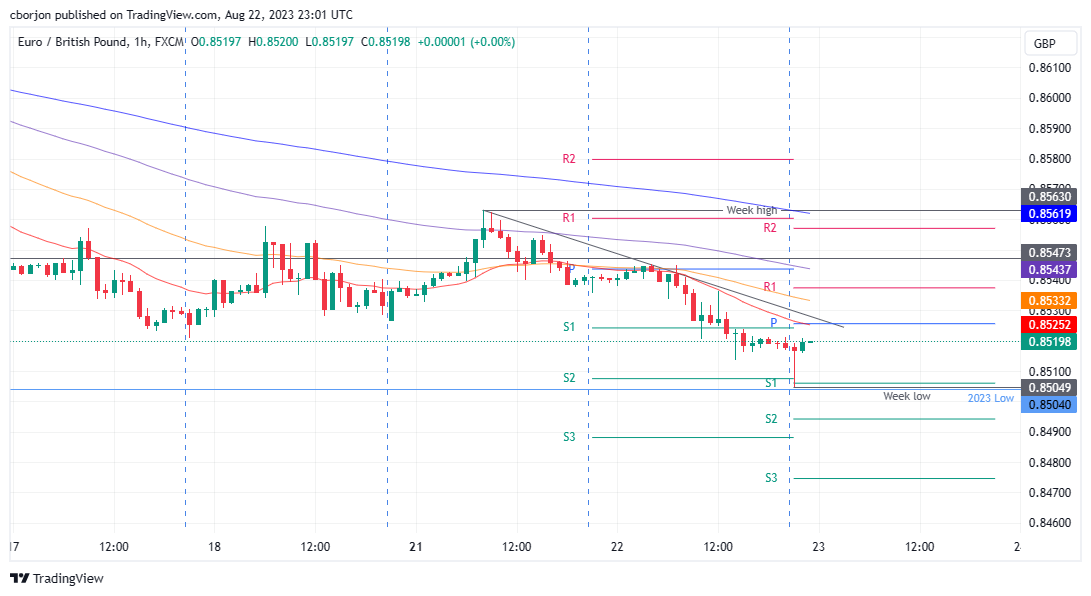
- Short-term bearish outlook supported by 50-HMA and daily pivot at 0.8522/26; resistance at 0.8540 and support at 0.8504.
According to the daily chart, the EUR/GBP currency pair remains locked in a narrow range between 0.8500 and 0.8550 for the fifth consecutive day. Despite this sideways action, the Euro (EUR) briefly dipped to a year-to-date low of 0.8504 before recovering slightly to the 0.8520 area as Wednesday’s Asian session began.
EUR/GBP Price Analysis: Technical outlook
The EUR/GBP daily chat portrays the pair in sideways action, within the 0.8500/0.8550 for the fifth consecutive day, though Euro (EUR) weakness triggered a fall to crack year-to-date (YTD) lows of 0.8504 and bounced towards the 0.8520 area. Sellers could extend the cross fall once they reclaim 0.8500. In that outcome, the EUR/GBP’s next support would be last year’s August 22 low at 0.8408. Conversely, the EUR/GBP could shift upwards if it reclaims 0.8600.
In the short term, the EUR/GBP hourly chart portrays a bearish continuation, as the intersection of the 50-hour Moving Average (HMA) with the daily pivot point at 0.8522/26 would be challenging to overcome. In addition, the downslope resistance trendline passes around 0.8540. If EUR/GBP breaks above those levels, the next resistance would be the 100-HMA at 0.8533, followed by the R1 pivot at 0.8537. Contrarily, and on the path of least resistance, the EUR/GBP’s first support would be the YTD low of 0.8504. Once cleared, the next support would be the S2 pivot at 0.8494, followed by the S3 daily pivot point at 0.8475.
EUR/GBP Price Action – Daily chart
