USD/JPY closes below 146.00; JPY still vulnerable
- USD/JPY closed near the 145.80 area as bulls showed signs of exhaustion.
- US and Japan’s PMIs from August will be Wednesday’s highlights.
- Investors await fresh catalysts to model their expectations on the Fed and BoJ.
In Tuesday’s session, the JPY traded strongly against most of its rivals, mainly driven by the 10-year Japanese bond yield rise, which rose to its highest level since 2014, past 0.60%. On the USD side, the Greenback traded mixed against its rivals, while investors remain cautios ahead of the Jackson Hole Symposium kick-off on Thursday, followed by Jerome Powell’s speech on Friday to continue placing their bets regarding the next Federal Reserve (Fed) decisions.
On Wednesday, investors will pay close attention to the S&P Global PMIs from the US from August, which will also help investors model their expectations in relation to the US economic outlook. During the early Asian session, the Jibun Bank will release the Japanese PMIs from the same month.
Regarding the Federal Reserve (Fed) decisions, markets continue to bet to a no-hike in the September meeting and place nearly 40% bets of a 25 basis point (bps) hike on the November meeting. On the Bank of Japan (BoJ) side, the rise in the Japanese yields indicates that markets are hoping for a tweak, but as for now, the bank hasn’t given any signals about leaving its monetary policy.
USD/JPY Levels to watch
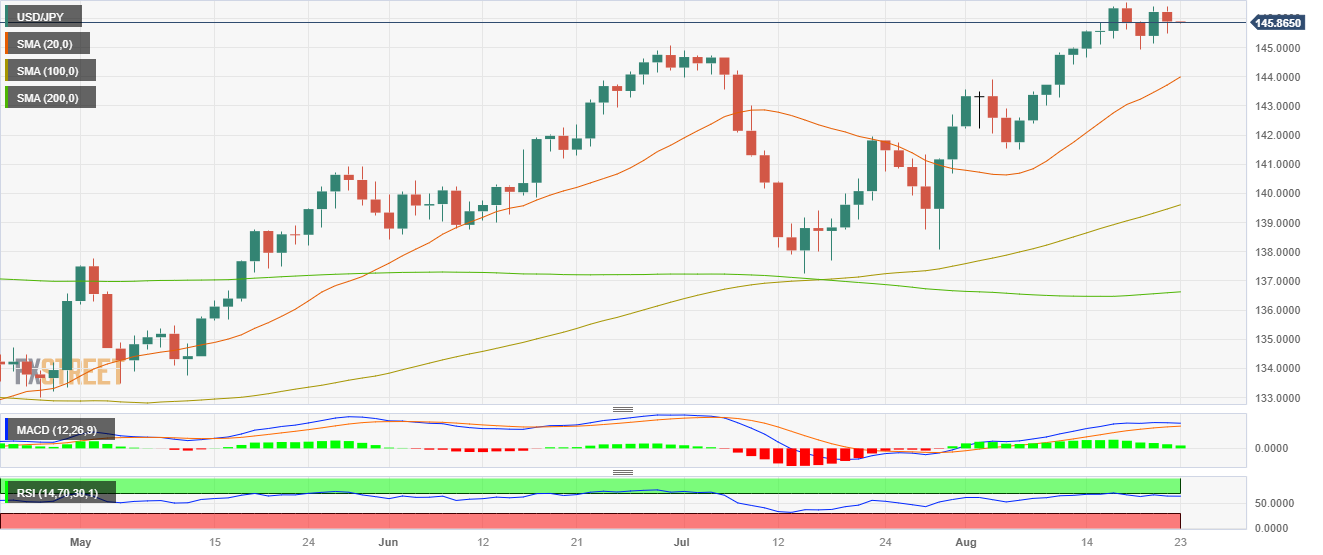
The USD/JPY suggests a neutral to bearish technical outlook on the daily chart as bullish momentum wanes. The Relative Strength Index (RSI) indicates a negative slope above its midline, and the Moving Average Convergence Divergence (MACD) displays fading green bars. .On the other hand, the pair is above the 20,100,200-day Simple Moving Average (SMAs), suggesting that the bulls are firmly in control of the bigger picture.
Support levels: 145.00. 144.50, 143.97 (20-day SMA)
Resistance levels: 146.00, 146.50, 147.00
USD/JPY Daily chart
