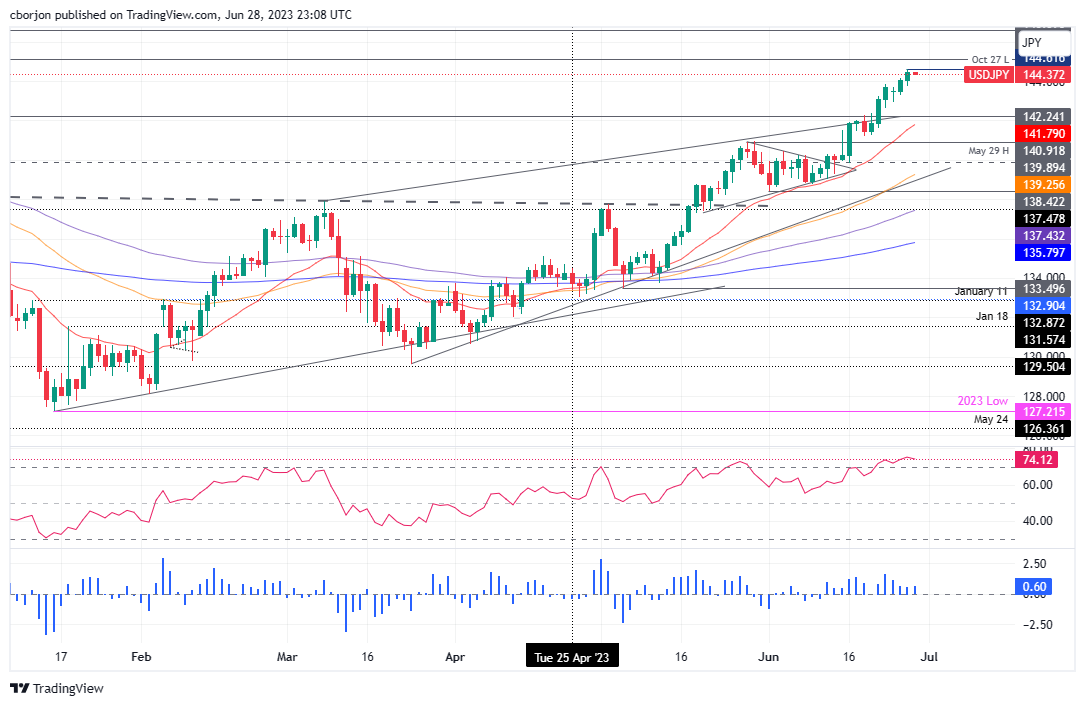
USD/JPY Price Analysis: Firm at around 144.40, as bull's eye 145.00 and beyond
- USD/JPY extends gains for six consecutive days, hitting a new YTD high but stabilizing ahead of the Tokyo Open.
- Despite overbought signals from the RSI, the strong uptrend justifies readings above 70, with a potential reversal at 80.
- USD/JPY’s breach past 145.00 may lead to resistance at 145.10 and 146.00, while a reversal could find support at 144.00 and 143.73.
The USD/JPY extends its gains to six straight days, but as Thursday’s Asian session begins, it retraces some 0.08% ahead of the Tokyo open. On its way north, the USD/JPY reached a new year-to-date (YTD) high of 144.61 but stabilized and finished around 144.40. At the time of writing, the USD/JPY exchanges hands at around the 144.30 area.
USD/JPY Price Analysis: Technical outlook
The USD/JPY remains upward biased but subject to verbal intervention by Japanese authorities. Even though the Relative Strength Index (RSI) suggests that prices are overbought, it remains shy of reaching extreme readings close to 80. In this case, the USD/JPY strong uptrend justifies RSI above 70, and once it comes the 80 level, the chances for a possible reversal increase.
Oscillators like the Relative Strength Index (RSI) is overbought but shy of getting to 80, while the three-day Rate of Change (RoC) suggests buying pressure is fading.
If USD/JPY climbs past 145.00, the next resistance will be the October 27 daily low at 145.10. Breach of the latter will expose the 146.00 figure, followed by the November 10 daily high at 146.59.
Conversely, if USD/JPY prints a reversal, the next support would be the 144.00 figure. Break below will expose the June 28 daily low of 143.73, followed by the November 22 daily high of 142.24.
USD/JPY Price Action – Daily chart
