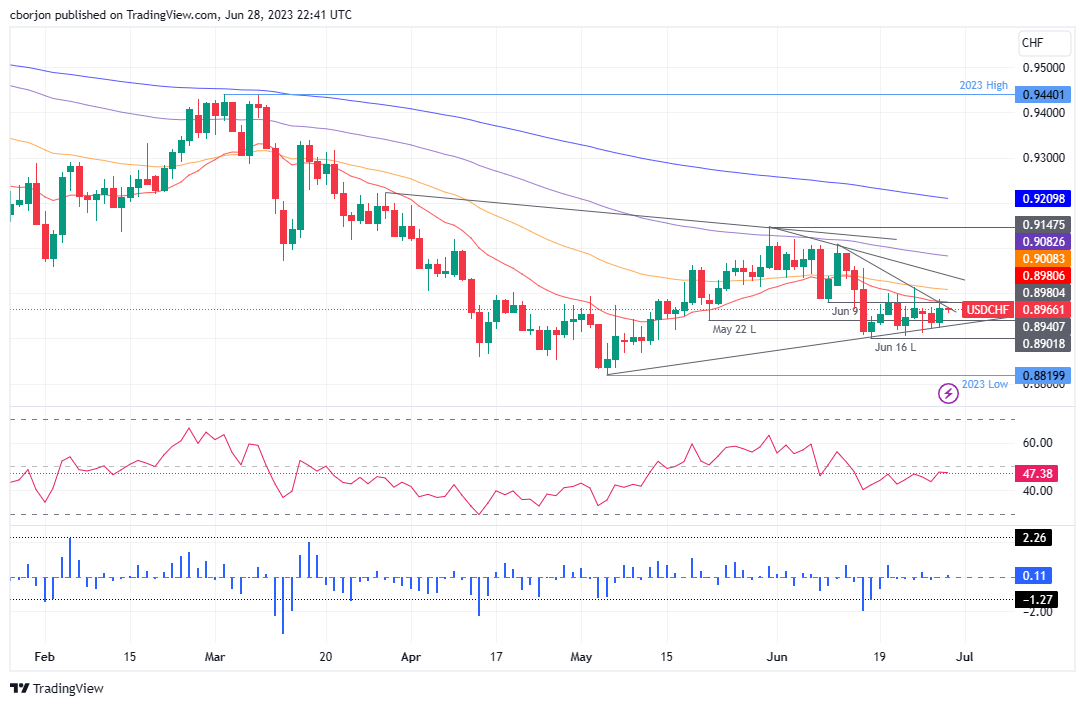
USD/CHF Price Analysis. Eyes breakout amid Fed tightening speculations
- USD/CHF rebounds and trades with minor losses of 0.02%, rallying from two-day lows amid Federal Reserve tightening speculations.
- The USD/CHF remains neutral, testing a downslope resistance trendline, but key oscillators hint at an impending bullish turn.
- If USD/CHF reclaims 0.9000, resistance emerges at the 50-day EMA, with supports at the June 28 low and the YTD low.
As the Asian session began, the USD/CHF traded with minuscule losses of 0.02%; following Wednesday’s session, the USD/CHF pair rallied from two-day lows of 0.8922 and rose toward a daily high of 0.8687. Speculations of further tightening by the Federal Reserve (Fed) spurred a leg-up in the USD/CHF. At the time of writing, the USD/CHF exchanges hands at 0.8966.
USD/CHF Price Analysis: Technical outlook
From a medium-term perspective, the USD/CHF is neutral biased but testing a downslope resistance trendline at around the 0.8970/90 area. Oscillators like the Relative Strength Index (RSI), although in bearish territory, is about to turn bullish as it closes to the 50-midline. Meanwhile, the three-day Rate of Change (RoC) suggests buyers are gathering momentum, despite lacking the strength to pierce the 0.9000 mark.
If USD/CHF reclaims the 0.9000 figure, immediate resistance will emerge from the 50-day Exponential Moving Average (EMA) at 0.9008. above that price level lies a downslope resistance trendline drawn in late May, which passes around 0.9030/40 before the USD/CHF can rally toward the 100-day EMA at 0.9082.
Conversely, the USD/CHF first support would be the June 28 daily low at 0.8922, followed by the 0.8900 figure, ahead of challenging the year-to-date (YTD) low of 0.8819.
USD/CHF Price Action – Daily chart
