Gold Price Forecast: XAU/USD recovery looks to $1,930, United States data and Jackson Hole event
- Gold Price rebounds on market’s cautious optimism and a pullback in United States Treasury bond yields.
- Upbeat US-China trade news, expectations of nearness to major central banks’ policy pivot propel XAU/USD.
- Two-day Jackson Hole Symposium begins, dovish central bankers could accelerate Gold Price upside.
- Friday’s Fed Chair Powell’s speech eyed, especially after mixed US data, defense of hawkish policy can recall XAU/USD bears.
Gold Price (XAU/USD) stays on the front foot at around $1,917, despite posting mild gains amid the early hours of Thursday’s Asian session, as market players await the United States data and the start of the two-day-long annual Jackson Hole Symposium.
The XAU/USD portrayed the biggest daily jump in five weeks amid the broad risk-on mood and a slump in the US Treasury bond yields. While acting as the main catalysts, mostly downbeat Purchasing Managers Index (PMI) for August from the top-tier economies and the US-China ties gained major attention.
Gold Price rally on firmer sentiment, downbeat Treasury bond yields
Gold Price benefits from the risk-on mood, as well as a pullback in the Treasury bond yields from the multi-year high as market players brace for the Jackson Hole Symposium.
Among the top-tier risk catalysts, the recently upbeat headlines surrounding the US-China trade ties and fresh expectations of witnessing a sooner end to the hawkish monetary policy cycle at the major central banks gain attention. It’s worth noting that the mostly downbeat Purchasing Managers Index (PMI) for August from the top-tier economies restored the market’s previous concerns about the central bank policy rates.
That said, preliminary readings of the US S&P Global Manufacturing PMI dropped to 47.0 for August from 49.0 versus 49.3 market forecasts whereas the Services counterpart also edged lower to 51.0, compared to 52.2 expected and 52.3 marked the previous month. With this, the S&P Global Composite PMI for the US eased to 50.4 for the said month from 52.0 prior and the analysts’ estimations. Further, US New Home Sales change rose to 4.4% MoM for July versus -2.5% previous readings.
Not only in the US but the first activity readings from the UK, Australia, Eurozone and Germany were all downbeat and challenged the hawkish central bank bias, which gained attention the late July and weighed on the Gold Price. It’s worth observing that Japan’s PMI improved but the Bank of Japan (BoJ) is already defending its ultra-easy monetary policy and there’s no harm for the XAU/USD there.
Elsewhere, a likely improvement in the US–China ties, due to US Commerce Secretary Gina Raimondo’s visit to Beijing, scheduled for next week, adds to the firmer sentiment. On the same line are the early-week news suggesting the US removal of 27 Chinese entities from its Unverified List, lifting sanctions from those entities and flagging hopes of improving diplomatic ties. Additionally, improvements in technology stocks and overall equities also allowed the Gold buyers to return to the table.
Against this backdrop, the US Dollar Index (DXY) retreated from the 11-week high and underpinned the XAU/USD run-up while the Wall Street benchmarks also closed in the positive territory to offer a helping hand to the Gold buyers.
More importantly, the US 10-year Treasury bond yields flashed the biggest daily fall in three weeks to portray the market’s optimism and propel the Gold Price.
More data, Jackson Hole start eyed ahead of Powell’s speech
While the start of a two-day-long annual Jackson Hole Symposium organized by the Kansas Federal Reserve (Fed) gains the Gold trader’s attention, the US Durable Goods Orders and weekly Jobless Claims could offer more directions for a precise prediction of the XAU/USD price.
Above all, Friday’s speech of Fed Chair Jerome Powell will be closely watched as the recent US data and interest rate futures point towards the US central bank’s policy pivot but Fed’s Powell isn’t known for his dovish style.
That said, upbeat US data and the central bankers’ readiness to keep the rates higher for longer may weigh on the Gold Price.
Also read: Jackson Hole Preview: Powell poised to keep markets on edge, three scenarios for the US Dollar
Gold Price Technical Analysis
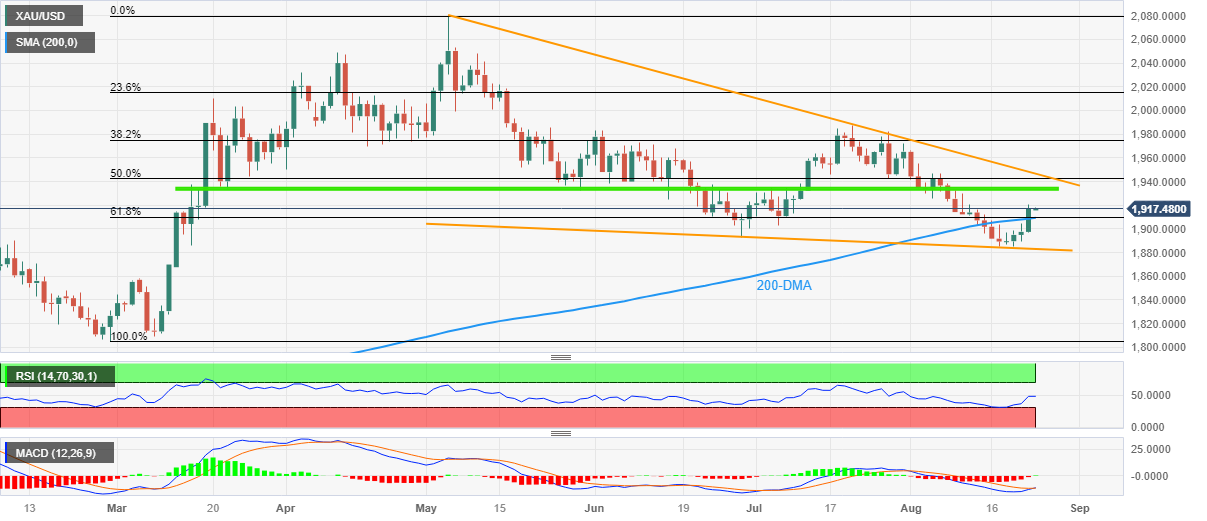
Gold Price extends the early-week rebound from the lowest level in 5.5 months while grinding higher past the $1,910 resistance confluence, now immediate support, comprising the 200-DMA and 61.8% Fibonacci retracement of February-May upside.
The XAU/USD also gains support from a rebound in the Relative Strength Index (RSI) line, placed at 14, from the oversold territory, as well as a looming bull cross on the Moving Average Convergence and Divergence (MACD) indicator.
Hence, the Gold Price is likely to extend the latest run-up towards a horizontal area comprising multiple levels marked since mid-March, around $1,930–35.
However, the 50% Fibonacci retracement level and a downward-sloping resistance line from early May, respectively near $1,942 and $1,950, could challenge the XAU/USD buyers afterward.
On the contrary, a daily closing beneath the $1,910 resistance-turned-support could recall the Gold sellers. However, a two-month-old descending support line, close to $1,883 at the latest, could join the nearly oversold RSI conditions to put a floor under the XAU/USD price afterward.
In a case where the Gold Price remains bearish past $1,883, the early March swing high of around $1,858 will be the last defense of the buyers before challenging the late 2022 bottom surrounding $1,804.
To sum up, the Gold Price is likely to remain firmer but the confirmation of the bullish trend is yet elusive.
Gold Price: Daily chart

Trend: Limited upside expected