Gold Price Forecast: XAU/USD closed above the 200-day SMA rising to a two-week high
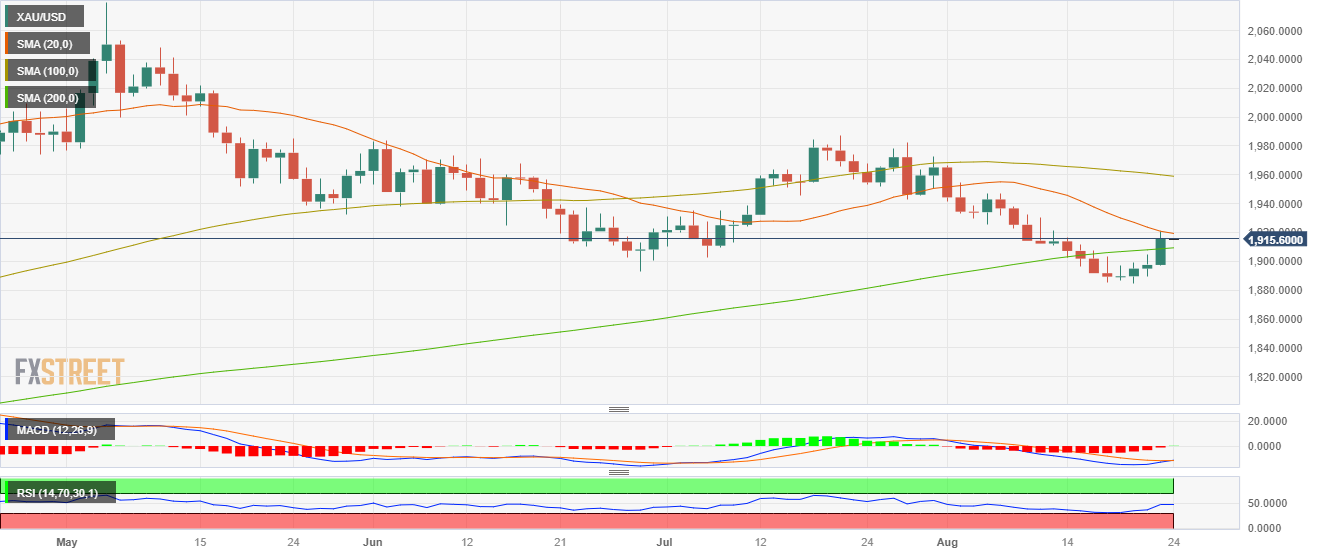
- XAU/USD rose above the 200-day SMA but was rejected by the 20-day average, settling at $1,915.
- US PMIs from August came in a tick lower than expected.
- Lower US yields allowed the yellow metal to gain traction.
In Tuesday’s session, the XAU/USD Gold spot price found demand as the leading world economies showed weak economic activity figures, which fueled a decline in global Treasury yields. Precious metals rallied, with Silver leading the day and showing more than 3% gains.
Investors digest poor US PMIs
The US S&P Global PMIs came in soft. The Manufacturing PMI dropped to 47 vs. the 49.3 expected, while the Services index remained in expansion territory at 51 despite coming lower than expected.
As a reaction, US bond yields are often seen as the opportunity cost of holding non-yielding metals, declined as investors seem to be betting on a less aggressive Federal Reserve (Fed). The 2-year yield dropped to 4.97% while the 5 and 10-year rates to 4.37% and 4.19%, respectively, showing more than 1% declines. Indeed, the CME FedWatch tool indicates that the odds of a 25 basis point hike in the upcoming November meeting eased to 35% from 40% at the start of the week while markets remain confident that the Fed will pause in September. On the USD DXY index side, it found resistance at the 104.00 level and settled near 103.60 following the data.
The focus now shifts to Jerome Powell’s speech on Friday, where investors will look for further clues on the next moves by the Fed. Weekly Jobless Claims on Thursday from the US will also be closely watched.
XAU/USD Levels to watch
With both the Relative Strength Index (RSI) and the Moving Average Convergence Divergence (MACD) comfortably placed in positive territory on the daily chart, the XAU/USD buyers hold the upperhand. The upward slope of the RSI further reinforces this positive sentiment, as does the MACD, which displays green bars, indicating a strengthening bullish momentum. Additionally, the pair is above the 20,100,200-day Simple Moving Averages (SMAs), implying that the bulls retain control on a broader scale.
Support levels: $1,910 (200-day SMA), $1,900, $1,880.
Resistance levels: $1,920 (20-day SMA), $1,950, $1,970.
XAU/USD Daily chart
