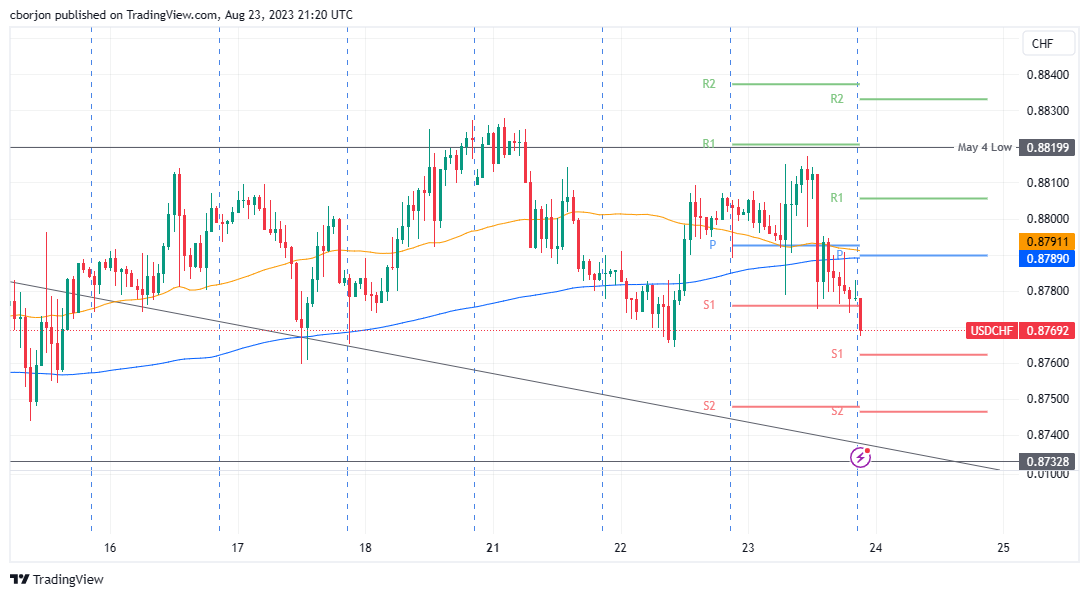
USD/CHF Price Analysis: Within a narrow range, hovers around the 0.8750s area
- USD/CHF trades in a tight 0.8765 to 0.8830 range for eight days, currently sitting near the mid-point of the 0.8700/0.8800 range.
- Intraday outlook suggests next support at this week's low of 0.8764; a break could expose the August 11 daily low of 0.8767.
- First resistance seen at the confluence of the daily pivot point and the 200-HMA at 0.8789/90; clearing this could aim for 0.8817.
USD/CHF has been trading within a narrow range of 0.8765 to 0.8830 for the past eight days, following a break of the 0.8600 figure. At the time of writing, the USD/CHF is trading beneath the 50-DMA, at around the mid-point of the 0.8700/0.8800 range, as the Asian session begins.
USD/CHF Price Analysis: Technical outlook
After breaching the 0.8800 figure, the USD/CHF remains subdued, unable to break above or below the 0.8765/0.8830 range for the last eight days. It should be said the major oscillates around the 50-day Moving Average (DMA) at 0.8798, trading on both sides of the DMA, while investors remain undecided to take a clear direction.
From an intraday point of view, the USD/CHF one-hour chart portrays the pair as neutral to downward biased, as it was set to finish Wednesday’s session near the lows of the day/week. Hence, the USD/CHF next support would be the current week’s low of 0.8764, followed by the S2 daily pivot at 0.8746. A decisive break would expose the August 11 daily low of 0.8767.
On the flip side, the USD/CHF first resistance would be the confluence of the daily pivot point and the 200-hour Moving Average (HMA) at 0.8789/90. If the pair clears that level, the pair’s next stop would be the R1 pivot point at 0.8806, followed by the August 23 high at 0.8817.
USD/CHF Price Action – Hourly chart
