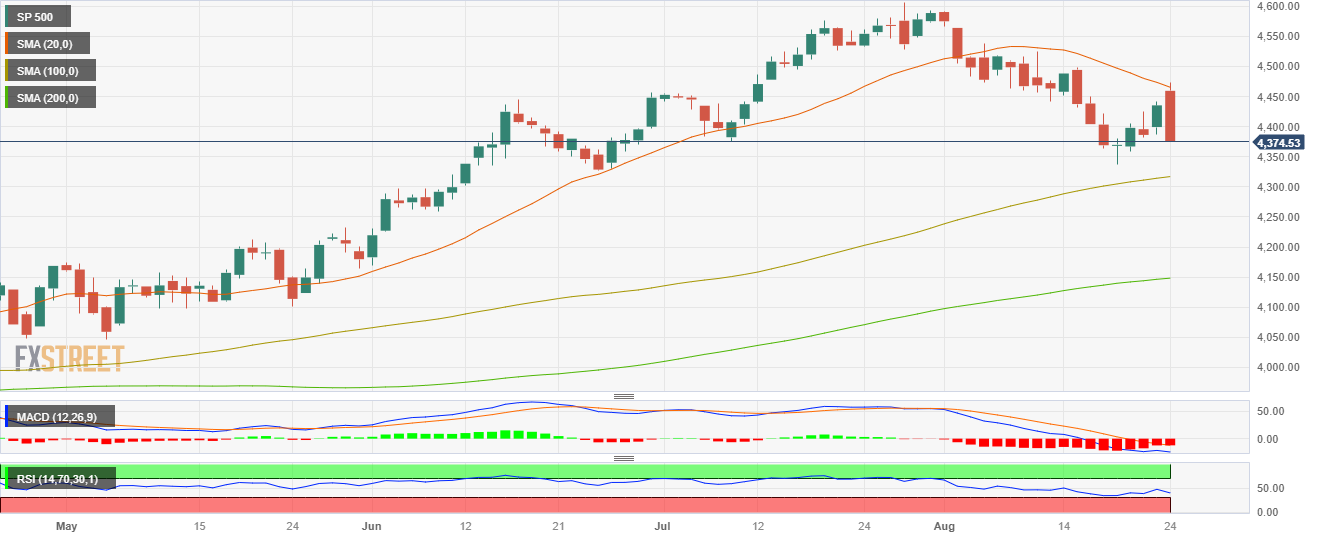
S&P 500 plunges more than 1% as Jackson Hole kicks off
- The SPX erased all of Wednesday’s gains, retreating to 4,380.
- Thomas Barkin and Susan Collins sounded hawkish at the start of the Jackson Hole Symposium.
- All eyes are now on Friday’s speech by Jerome Powell.
On Thursday, the US stock market saw losses driven by a stronger USD, boosted amid hawkish remarks by Federal Reserve (Fed) officials at the Jackson Hole Symposium.
Thomas Barkin stated that the Fed will keep rates where they are for the rest of 2023 and push rate cuts to 2024. In addition, Susan Collins commented that “more rate hikes are possible” which made markets place bets on a more aggressive Fed. In line with that, US yield rose, making stocks lose interest. The 2-year rate rose to 5%, while the 5 and 10-year rates increased to 4.44% and 4.23%, respectively.
Eventually, it will come down to the next set of data that the Fed will receive, including an additional jobs report and inflation reading. Powell’s words on Wednesday will also be closely watched for investors to model their expectations.
SPX Levels to watch
The daily chart suggests that the SPX displays a neutral to bearish outlook. The Relative Strength Index (RSI) points south in negative territory, while the Moving Average Convergence Divergence (MACD) prints red bars. However, the index remains above the 100 and 200-day Simple Moving Averages (SMAs), indicating that the bull retains control of the bigger picture.
Support Levels to watch: 4,350, 4,330, 4,310 (100-day SMA).
Resistance Levels to watch: 4,400, 4,460 (20-day SMA), 4,480.
SPX Daily chart
