AUD/USD nears cycle low after Powell’s hawkish remarks
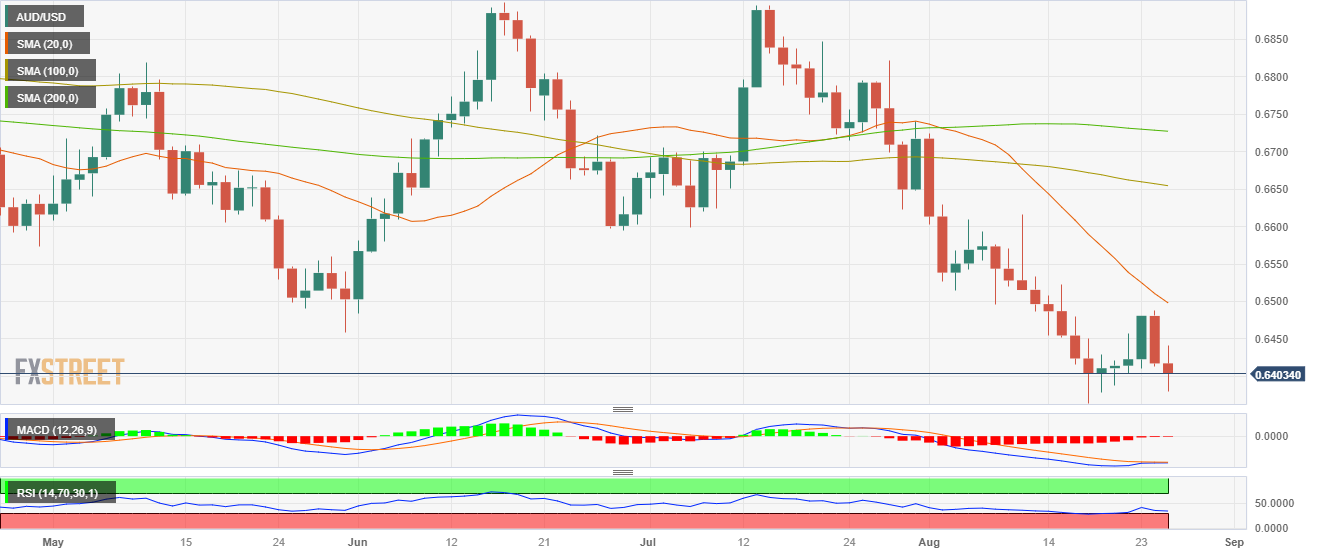
- AUD/USD fell more than 0.50%, to a daily low near 0.6380.
- Jerome Powell opened the door to another hike in this tightening cycle.
- Rising US yields make the USD gain interest.
At the end of the week, the USD gained ground against its rivals, mainly driven by the Federal Reserve’s (Fed) chairman, Jerome Powell, at the Jackson Hole Symposium. On the Aussie side, no relevant data or events are on the docket in Friday’s session.
Jerome Powell’s speech at the Jackson Hole Symposium sounded hawkish. He stated that the economy didn’t cool down as expected and that the Fed will proceed “carefully” for the next decisions. He then pointed out that “there is no way to know what the neutral rate would be,” and markets are betting higher odds of another hike in 2023.
According to the CME FedWatch tool, the odds of a 25 basis points (bps) hike in November rose to nearly 44% vs. 33% a week ago. The odds of a pause remain high in September while investors are betting on cuts in June-July 2024.
As a reaction, the US Treasury yield rose, with the 2,5 and 10-year rates rising to 5.07%, 4.46% and 4.25%, respectively, giving the USD a boost.
AUD/USD Levels to watch
Based on the daily chart, it is evident that AUD/USD leans toward a bearish outlook in the short term. The Relative Strength Index (RSI) remains below its midline in negative territory, showcasing a southward slope. Similarly, the Moving Average Convergence Divergence (MACD) exhibits red bars, emphasising the strengthening bearish momentum for AUD/USD. Also, the pair is below the 20,100 and 200-day Simple Moving Averages (SMAs), implying that the bears retain control on a broader scale.
Support levels: 0.6380, 0.6370 (cycle low), 0.6350.
Resistance levels: 0.6435, 0.6480, 0.6500 (20-day SMA).
AUD/USD Daily chart
