Gold Price Forecast: XAU/USD bulls eye $1,950 and US inflation, employment clues for confirmation
- Gold Price stays defensive within multi-day-old falling wedge after snapping four-week downtrend.
- Mixed United States data, pullback in Treasury bond yields lure XAU/USD buyers within bullish chart pattern.
- Federal Reserve Chairman Jerome Powell, other policymakers defend hawkish bias but cite data dependency to prod Gold bears.
- Fed’s preferred inflation gauge, NFP will guide US Dollar and can favor XAU/USD rebound on downbeat outcomes.
Gold Price (XAU/USD) edges higher to around $1,915 as it defends the first weekly gain in five while marking no major surprises to begin the trading week. That said, the XAU/USD cheered a pullback in the United States Treasury bond yields, as well as the mixed statements from the major central bank officials at the annual Jackson Hole Symposium, to recall the buyers after their four-week absence. However, the cautious mood ahead of this week’s top-tier inflation and employment clues from the United States prods the Gold Price upside amid the initial hour of Monday’s Asian session.
Gold Price recovers even as Powell’s speech defends hawks
Gold Price cheered a pullback in the United States Treasury bond yields despite hawkish Federal Reserve (Fed) remarks in the last week. Additionally, mixed US data also allowed the XAU/USD buyers to remain hopeful.
During the last week, the softer prints of the US Purchasing Managers Index and Michigan Consumer Sentiment Index contrasted with mixed details of Durable Goods Orders, mid-tier activity data and inflation expectations. However, hawkish comments from Federal Reserve (Fed) Chairman Jerome Powell at the annual Jackson Hole Symposium helped the US Dollar Index (DXY) to post the fifth consecutive weekly gain while poking the three-month high.
That said, Fed’s Powell reiterated his defense for “higher for longer” rates while stating that the policy is restrictive but the Fed can’t be certain what neutral rate level is. The policymaker also added that there is substantial further ground to cover to get back to price stability while also stating that the economic uncertainty calls for agile monetary policy-making.
Apart from Powell’s speech, the comments of Federal Reserve Bank of Cleveland President Loretta J. Mester also appeared hawkish as she warned that the under-tightening would be worse than overtightening. The policymaker also added, “We are getting close to where we need to be with rates.”
Further, Federal Reserve Bank of Philadelphia President Patrick Harker told Bloomberg that he doesn't see the need now for additional rate increases but added that he could call for more hikes if inflation retreat stalled.
It should be noted that the policymakers from the rest of the major central banks, including the European Central Bank (ECB), Bank of England (BoE) and the Bank of Japan (BoJ), also appeared cautiously hawkish and hence allowed the Gold buyers to stay hopeful.
That said, the US Dollar Index (DXY) rose for the fifth consecutive week but the benchmark 10-year Treasury bond yields snapped the four-week uptrend by posting minor weekly losses as it retreated from the highest level since 2007.
Additionally, the slight improvement in the technology shares and mildly positive outlook of the overall equities market also prod the Gold Price downside.
It’s worth noting that the market’s preparations for US Commerce Secretary Gina Raimondo’s visit to Beijing, as well as China’s readiness for more stimulus, also lures the XAU/USD buyers due to the Dragon Nation’s status as one of the world’s biggest Gold customers.
Fed’s favorite inflation gauge, United States employment clues will direct XAU/USD
While the aforementioned catalysts allowed the Gold buyers to enter the wing, their victory will depend upon the Federal Reserve’s (Fed) favorite inflation gauge, namely the Core Personal Consumption Expenditure (PCE) Price Index for July, and the monthly employment data. Additionally, the ISM PMIs for August and the second readings of the US second quarter (Q2) Gross Domestic Product (GDP) will also entertain the XAU/USD traders.
That said, outcomes suggesting firmer economic conditions in the US, a tight labor market and escalating price pressure will challenge the Gold buyers. However, the latest signals have been promising and continuations of the softer data might weigh on the US Dollar and fuel the XAU/USD towards the key technical upside hurdle, namely the $1,950 as stated below.
Also read: Gold Price Weekly Forecast: US jobs and inflation data could boost XAU/USD
Gold Price Technical Analysis
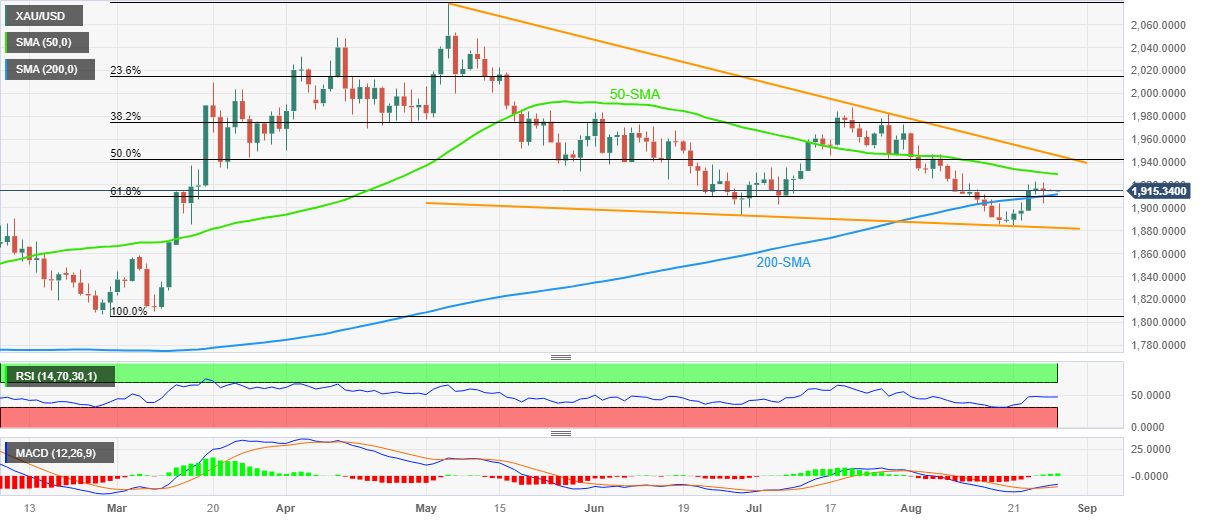
Gold Price not only managed to post the first weekly gain in five but also regained its place beyond the $1,910 support confluence comprising the 200-day Simple Moving Average (SMA) and 61.8% Fibonacci retracement of February-May upside.
Also keeping the XAU/USD buyers hopeful is the recently steady Relative Strength Index (RSI) line, placed at 14, as well as the bullish signals from the Moving Average Convergence and Divergence (MACD) indicator.
As a result, the Gold Price can extend the latest recovery towards the 50-SMA hurdle of around $1,930 and then to the 50% Fibonacci retracement level of around $1,943.
However, a falling wedge bullish chart formation comprising multiple levels marked since early May, currently between $1,948 and $1,883, appears crucial for the XAU/USD bulls to watch for taking control.
Meanwhile, the Gold Price downside past the $1,910 support confluence may stall around the $1,900 round figure ahead of challenging the stated wedge’s bottom line surrounding $1,883.
Following that, the early March swing high of around $1,858 should lure the XAU/USD bears.
To sum up, the Gold Price recovery is underway but the bulls need validation from $1,948.
Gold Price: Daily chart

Trend: Limited upside expected