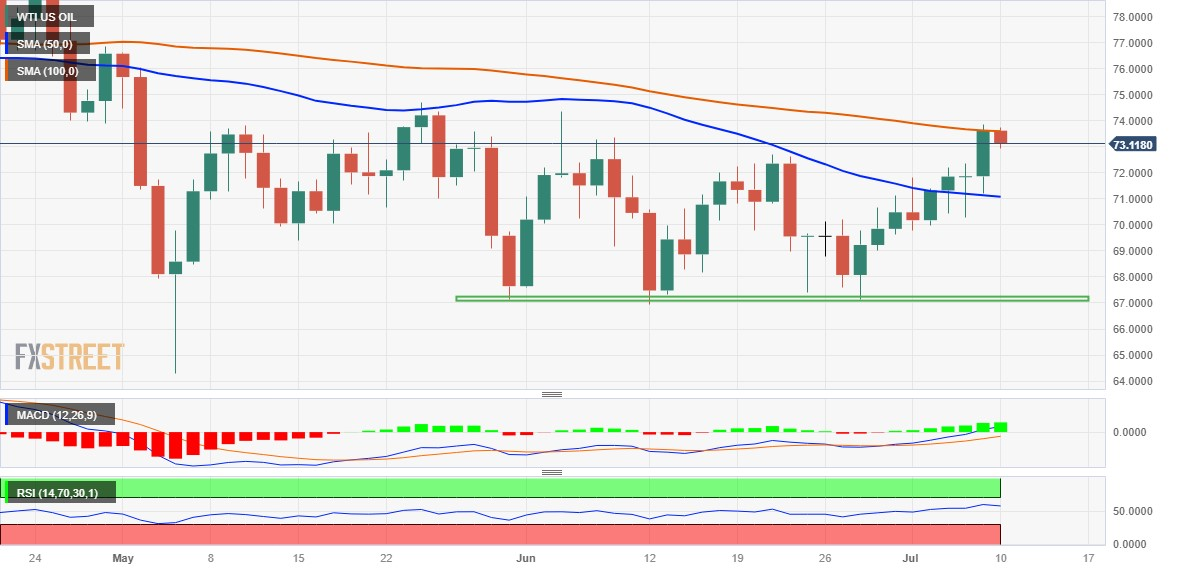
WTI Price Analysis: Retreats from over one-month top, bulls pause near 100-day SMA
- WTI Crude Oil prices face rejection near the 100-DMA and pull back from a one-month high.
- Last week's sustained strength and acceptance above the 50-day SMA favours bullish traders.
- Any meaningful corrective fall might now be seen as a buying opportunity and remain limited.
Western Texas Intermediate (WTI) Crude Oil prices struggle to capitalize on the recent rise witnessed over the past two weeks or so and face rejection near the 100-day Simple Moving Average (SMA) on Monday. The black liquid drops to a fresh daily low during the early European session, though shows some resilience below the $73.00 round-figure mark. Nevertheless, the commodity has eroded a part of Friday's strong gains to over a one-month high and currently trades around the $73.20-$73.25 region, down just over 0.50% for the day.
A slew of weak economic data from China released over the past week or so, including the softer inflation figures on Monday, add to worries about slowing growth in the world's second-largest economy, which might dent fuel demand. This, in turn, is seen as a key factor exerting some downward pressure on Crude Oil prices. That said, the expected supply cuts from the world's biggest oil exporters - Saudi Arabia and Russia - in August should help limit the downside and warrants some caution before placing aggressive bearish bets.
From a technical perspective, the recent strong rally from the $67.00 horizontal support and last week's sustained move beyond the 50-day Simple Moving Average (SMA) favours bullish traders. This, along with positive oscillators on the daily chart, suggests that the path of least resistance for Crude Oil prices is to the upside. Hence, any subsequent pullback is more likely to attract fresh buying near the $72.00 mark and is likely to remain cushioned near the 50-day SMA resistance breakpoint, currently around the $71.20-$71.15 region.
On the flip side, bulls might now wait for acceptance above the 100-day SMA barrier, currently pegged around the $73.75-$73.85 region, before positioning for any further gains. Crude Oil prices might then accelerate the positive momentum towards testing the next relevant hurdle near the $74.70-$74.75 region before aiming to reclaim the $75.00 psychological mark for the first time since early May.
WTI Crude Oil daily chart

Key levels to watch