Silver Price Analysis: XAG/USD struggles for a firm intraday direction, holds steady above $23.00
- Silver oscillates in a narrow trading range above the $23.00 mark on Monday.
- Mixed oscillators on hourly/daily charts warrant caution for aggressive traders.
- A sustained break below the $22.65-70 area might negate any positive outlook.
Silver kicks off the new week on a subdued note, albeit manages to hold its neck above the $23.00 round-figure mark through the early European session. The mixed technical setup, meanwhile, warrants some caution before placing aggressive directional bets.
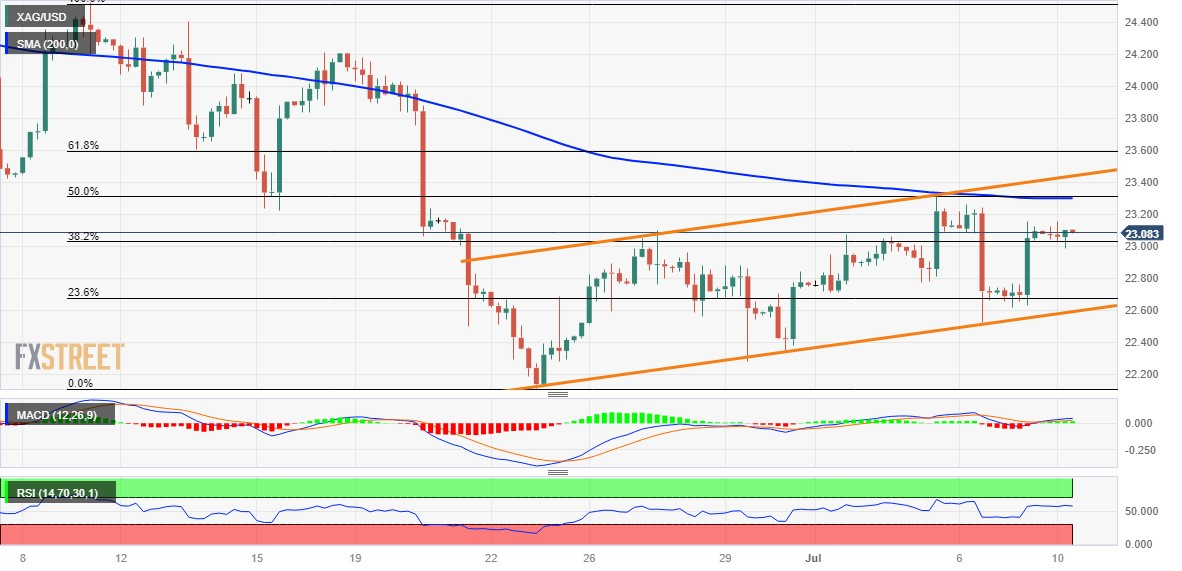
The recent recovery from the vicinity of the $22.00 mark, or the multi-month low touched in June, has been along an upward-sloping channel. Furthermore, last week's pullback from the $23.30 confluence - comprising the 50% Fibonacci retracement level of the downfall from the June peak and the 200-period Simple Moving Average (SMA) on the 4-hour chart - stalled near the lower end of the said channel. Moreover, positive oscillators on hourly charts favour bullish traders.
That said, technical indicators on the daily chart are yet to confirm a positive outlook. Hence, any subsequent move up might continue to face some resistance near the $23.30 confluence region. This is closely followed by the ascending trend-channel resistance, currently around the $23.45 region. A sustained strength beyond will confirm a positive breakout and lift the XAG/USD beyond the 61.8% Fibo. resistance near the $23.60 region, toward reclaiming the $24.00 mark.
The positive momentum could get extended further towards the $24.20-$24.25 intermediate barrier, above which the XAG/USD could climb back to the June monthly swing high, around the $24.55 region.
On the flip side, weakness back below the $23.00 mark, representing the 38.2% Fibo., is more likely to attract some buying and remain limited near the $22.65-$22.70 area, or the 23.6% Fibo. level. The latter should act as a pivotal point, which if broken could make the XAG/USD vulnerable to slide back towards the $22.mark. Some follow-through selling should pave the way for fall towards the $21.70-$21.65 zone en route to the $21.25 support and the $21.00 mark.
Silver 4-hour chart

Key levels to watch