USD/MXN Price Analysis: Peso retreats from six-week-old hurdle, focus on 200-SMA and Mexican GDP
- USD/MXN edges higher after bouncing off monthly low.
- RSI’s rebound from oversold territory, clear upside break of immediate descending resistance line lure Mexican Peso sellers.
- 200-SMA, Mexico GDP will test pair buyers before directing them to the key upside hurdle surrounding 17.05.
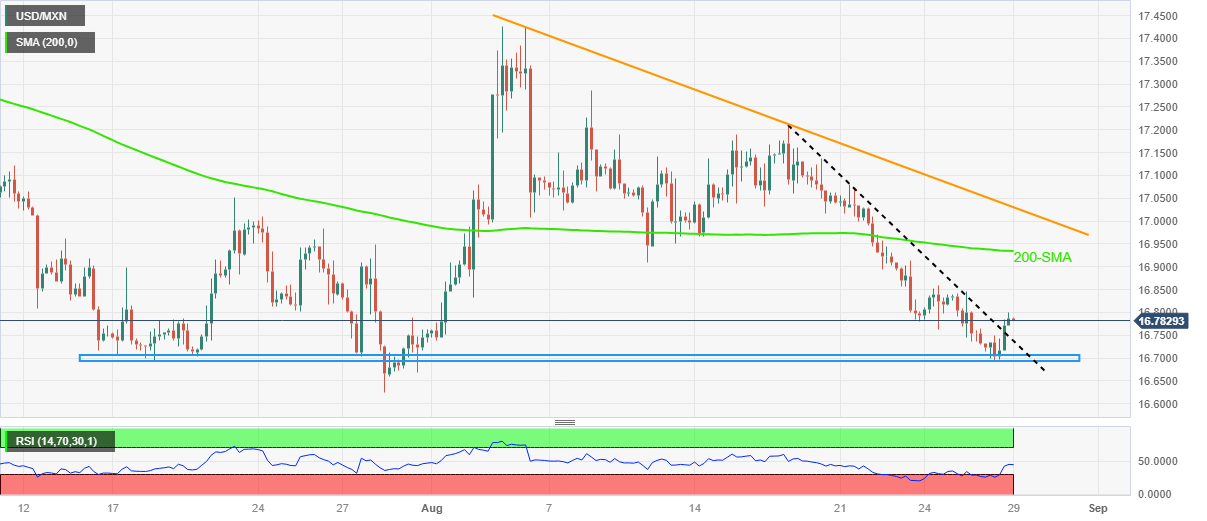
USD/MXN seesaws around 16.78-80 amid the early hours of Tuesday’s Asian session. In doing so, the Mexican Peso (MXN) pair struggles to defend the previous day’s rebound from a six-week-old horizontal support zone, as well as an upside break of an eight-day-long previous resistance line, ahead of Mexico’s second quarter (Q2) Gross Domestic Product (GDP). Also important to track is the US Conference Boards’ (CB) Consumer Confidence for August.
Also read: USD/MXN dives sharply despite hawkish Fed; eyes YTD low ahead of Mexico’s GDP
Given the upbeat RSI (14) line favoring the USD/MXN pair’s rebound from the key support zone, as well as an upside break of the previous resistance line, the buyers are likely to keep the reins unless the Mexican Q2 GDP data disappoints, expected 0.9% QoQ versus 1.0% prior.
With this, the latest recovery can approach the 200-SMA hurdle of around 16.95.
However, a downward-sloping resistance line from August 04, close to 17.05 by the press time, will challenge the USD/MXN bulls afterward.
In a case where the Mexican Peso (MXN) bears manage to conquer the 17.05 mark, the 17.20 level mark acts as a buffer during the run-up targeting the fresh monthly high, currently around 17.43.
On the flip side, the aforementioned resistance-turned-support line restricts the immediate USD/MXN downside near 16.73.
Following that, multiple levels marked since July 17, close to 16.70–69, will be crucial to watch as a clear downside break of the same won’t hesitate to refresh the multi-year low marked in July around 16.62.
USD/MXN: Four-hour chart

Trend: Limited upside expected