Silver Price Analysis: XAG/USD pullback towards sub-$24.00 region appears overdue
- Silver Price remains sluggish as buyers run out of steam around monthly high.
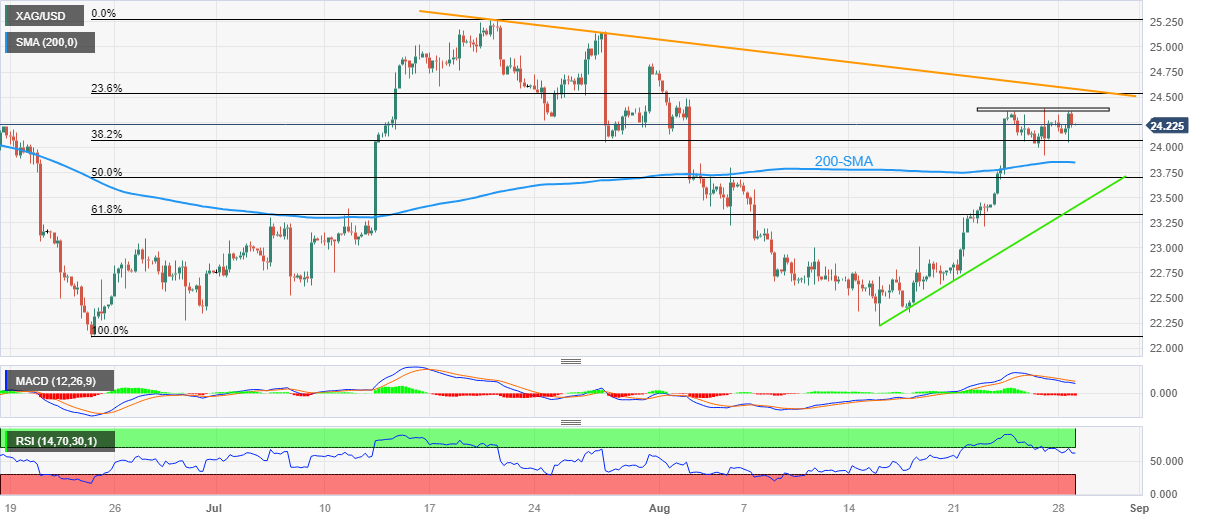
- One-week-old horizontal region joins bearish MACD signals to restrict immediate XAG/USD upside ahead of descending resistance line from late July.
- RSI’s retreat from overbought territory also suggests a pullback towards 200-SMA.
- Fortnight-old rising support line, key Fibonacci ratios act as additional downside filters.
Silver Price (XAG/USD) remains lackluster around $24.25 during the early hours of Tuesday’s Asian session, after failing to cross a one-week-long horizontal hurdle the previous day.
That said, the bearish MACD signals join the RSI (14) line’s retreat from the overbought territory to suggest a consolidation in the XAG/USD price amid sluggish markets, as well as the cautious mood ahead of the mid-tier US data.
With this, the bright metal’s fall towards the $24.00 round figure appears imminent. However, the Silver Price remains on the buyer’s radar unless it stays beyond the 200-SMA support of around $23.85.
In a case where the XAG/USD remains bearish past $23.85, the 50% Fibonacci retracement of June-July upside and a two-week-old rising support line, respectively near $23.70 and $23.45, will challenge the bears.
It’s worth noting that the 61.8% Fibonacci retracement, also known as the “Golden Fibonacci Ratio, of around $23.30 acts as the final defense of the Silver buyers.
On the flip side, the aforementioned one-week-old horizontal resistance area surrounding $24.35-40 guards immediate recovery of the Silver Price ahead of a downward-sloping resistance line from July 20, close to $24.60 of late.
Silver Price: Four-hour chart
Trend: Pullback expected
