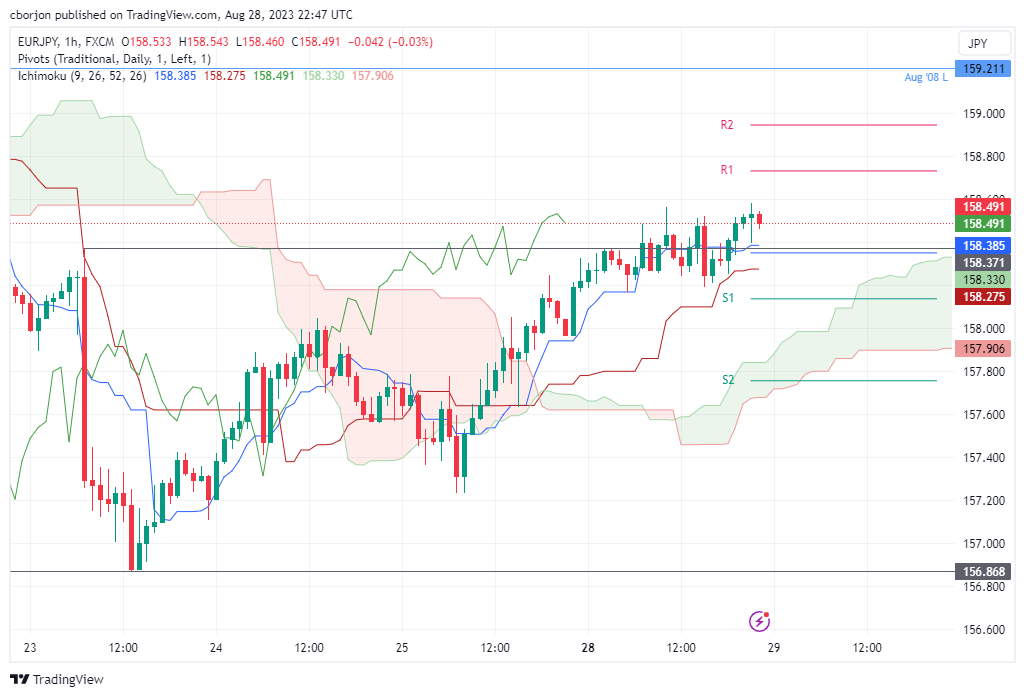
EUR/JPY Price Analysis: Despite rising, intra-day technicals favor bears
- EUR/JPY trades at 158.47, showing a neutral to downside bias as it hovers near the Tenkan-Sen line at 158.18, with key support and resistance levels in sight.
- Intraday charts suggest the pair may have peaked, dropping below the Tenkan Sen at 158.38, potentially triggering further losses towards the Kijun-Sen at 158.28.
- A climb towards the R1 pivot at 158.74 could set the stage for a retest of the year-to-date high at 159.49, depending on risk sentiment and market dynamics.
As the Asian session begins, the EUR/JPY registers minuscule losses after posting 0.31% of gains on Monday due to an improvement in risk appetite that dragged the pair from around daily lows of 157.97 to its high of 158.56. At the time of writing, the cross-currency pair trades at 158.47, down 0.03%.
EUR/JPY Price Analysis: Technical outlook
The EUR/JPY daily chart portrays the pair as neutral-biased, though slightly tilted to the downside, as it achieved a daily low below the August 18 swing low of 157.65. Nevertheless, the recent leg up could pave the way for retesting year-to-date (YTD) highs of 159.21 unless the EUR/JPY drops below the Tenkan-Sen line at 158.18, followed by the 158.00 mark. Once achieved, the next stop would be the August 23 daily low of 156.87, followed by the top of the Ichimoku Cloud (Kumo) at 155.96.
From an intraday perspective, the cross-currency pair appears to have peaked as EUR/JPY price action loses steam, with the pair failing to achieve a higher high that tests the 159.00 mark. If the EUR/JPY drops below the Tenkan Sen at 158.38, that could exacerbate further losses. The next support would be the Kijun-Sen at 158.28, followed by the S1 daily pivot at 158.14, and then the S2 pivot at 157.75.
Conversely, if EUR/JPY Climbs towards the R1 pivot at 158.74, a test of the YTD high at 159.49 is on the cards.
EUR/JPY Price Action – Hourly chart
