Silver Price Analysis: XAG/USD bulls need validation from $24.80 and US data
- Silver Price struggles with the key upside hurdle at monthly high.
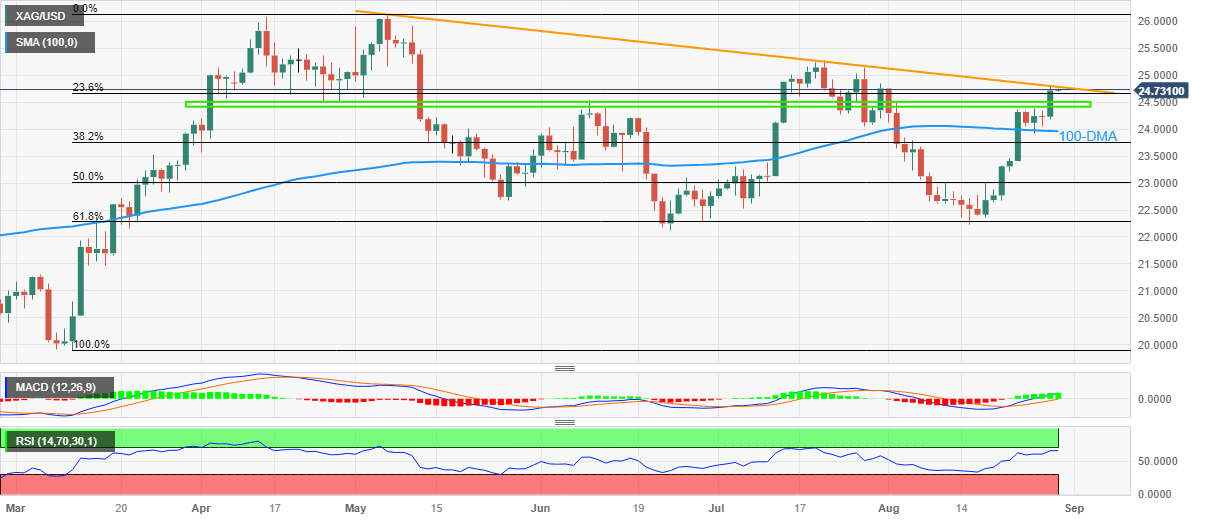
- Descending resistance line from early May challenges XAG/USD bulls amid nearly overbought RSI (14) line.
- Clear upside break of four-month-old horizontal resistance area, bullish MACD signals favor Silver buyers.
- 100-DMA, key Fibonacci retracement levels can prod XAG/USD pullback.
Silver Price (XAG/USD) remains sidelined near $24.70–75 during early Wednesday as bulls jostle with the key upside hurdle ahead of the US data.
It’s worth noting that the nearly overbought RSI joins a 16-week-old falling resistance line surrounding $24.80 to challenge the XAG/USD buyers.
However, the bullish MACD signals a daily closing beyond the four-month-long horizontal resistance zone, now immediate support around $24.50–40, which will test the Silver sellers.
Following that, the 100-DMA support of around $23.95 will precede the 50% and 61.8% Fibonacci retracements of March–May upside, respectively near $23.00 and $22.30, to offer a bumpy ride to the XAG/USD bears.
Meanwhile, a daily closing beyond the aforementioned resistance line of around $24.80 needs support from the US ADP Employment Change, the final readings of the US second quarter (Q2) Gross Domestic Product (GDP) and the Personal Consumption Expenditure (PCE).
Should the softer US data join the Silver Price upside beyond the immediate resistance line, the bulls can challenge the previous monthly high of around $25.30 ahead of targeting the yearly high marked in May at around $26.15.
Silver Price: Daily chart

Trend: Pullback expected